Message Boards Message Boards

0
|
7324 Views
|
2 Replies
|
0 Total Likes
View groups...
Share
Share this post:

ListPlot --> PlotLegend Colors Match PlotMarker Colors

Posted 10 years ago

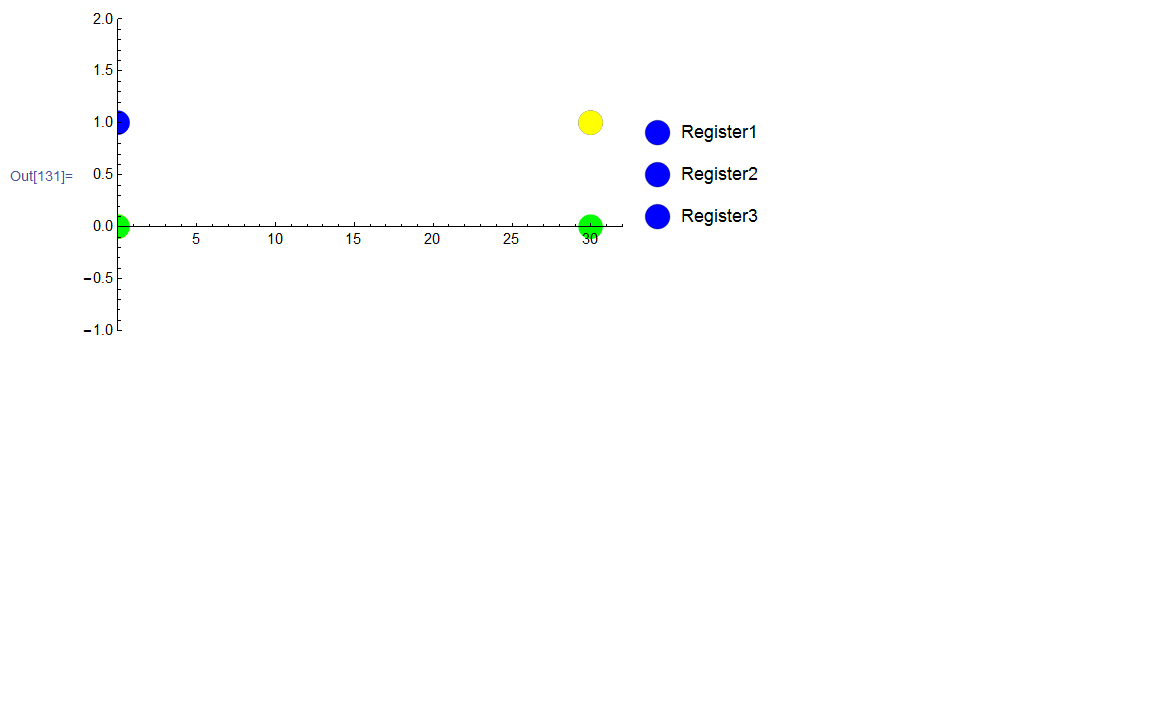
In the following code I am trying to get the shapes and colors shown in the legend to match the marker colors. Is there a way to do this either manually or automatically?

goodCase = {{{0,1},{N[(599392-569396)/1000],1}},{{0,0},{N[(599392-569396)/1000],1}},{{0,0},{N[(599392-569396)/1000],0}}};
dskB = Graphics[{Blue, Disk[]}];
dskY = Graphics[{Yellow, Disk[]}];
dskG = Graphics[{Green, Disk[]}];
ListPlot[goodCase,  PlotMarkers -> {{dskB,0.085},{dskY,0.085},{dskG,0.085}},PlotRange -> {{0,32},{-1,2}},PlotLegends -> {"Register1","Register2","Register3"}]

enter image description here


POSTED BY: Bob Stephens
2 Replies

Hi Bob,

In version 9, you could specify exact colors in the legend, for example:

PlotLegends -> SwatchLegend[{Blue, Yellow, Green}, {"Register1", "Register2", "Register3"}]

If you would like the shape of legend to match the markers, adding

LegendMarkers -> {dskB, dskY, dskG}

in the SwatchLegend will do.

In version 10, the legend should match the color and shape automatically with your original input.

POSTED BY: MinHsuan Peng
Posted 10 years ago

thanks Min Hsuan, that produces the result I was looking for - see plot below.

enter image description here

POSTED BY: Bob Stephens
Reply to this discussion
Community posts can be styled and formatted using the Markdown syntax.
Reply Preview
Attachments
Remove
or Discard

Group Abstract Group Abstract