Message Boards Message Boards

0
|
3479 Views
|
2 Replies
|
0 Total Likes
View groups...
Share
Share this post:
GROUPS:

Beginner Question: How to use DateListPlot to plot two FinancialData sets?

Posted 10 years ago

I want to plot (just for fun) Gold and Silver on a date list plot. My code looks like this:

DateListPlot[{FinancialData["GLD", "Jan 1,2006"]}, {FinancialData["SLV", "Jan 1,2006"]}, Joined -> True, PlotLegends -> {"Gold", "Silver"}]

While Mathematica doesn't throw any errors, it also doesn't plot (or label) silver! My resulting plot looks like this:

DateListPlot

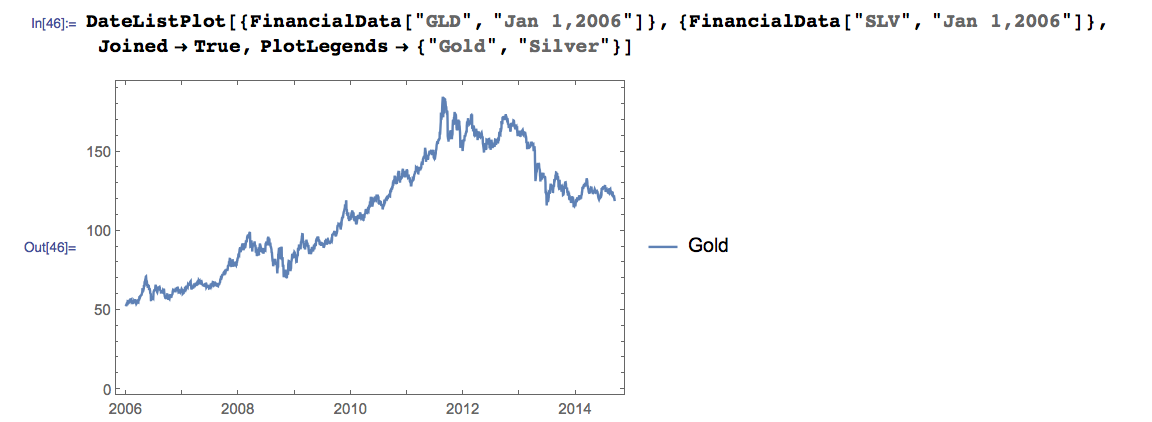
Could anybody clue me in to what my error is?

POSTED BY: Andrew Robertson
2 Replies

Thanks a lot Tim!

POSTED BY: Andrew Robertson

You have some braces that you don't need. This will work:

DateListPlot[{FinancialData["GLD", "Jan 1,2006"], 
  FinancialData["SLV", "Jan 1,2006"]}, Joined -> True, 
 PlotLegends -> {"Gold", "Silver"}]

Use the braces to hold all of the series that you want to plot, not each individual one.

Tim

POSTED BY: Tim Mayes
Reply to this discussion
Community posts can be styled and formatted using the Markdown syntax.
Reply Preview
Attachments
Remove
or Discard

Group Abstract Group Abstract