Clear[p, x, n];
yi = {1.2, 2.3, 3.6, 4.9, 5.9};
xi = {1, 2, 3, 4, 5};
data = Transpose[{xi, yi}];
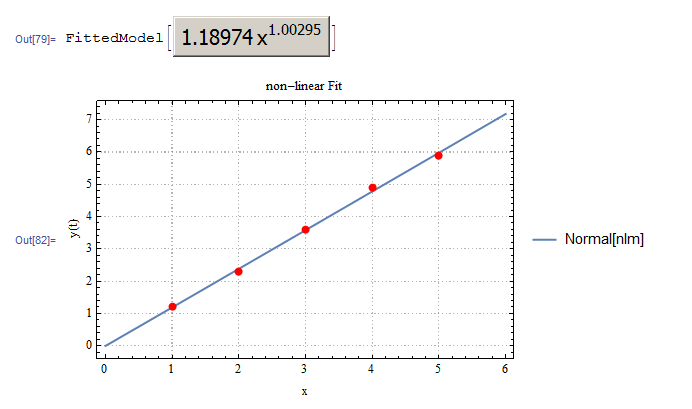
nlm = NonlinearModelFit[data, p x^n, {p, n}, x]
p1 = ListPlot[data, PlotStyle -> Red];
p2 = Plot[Normal[nlm], {x, 0, 6}, PlotTheme -> "Detailed",
              FrameLabel -> {{"y(t)", None}, {"x", "non-linear Fit"}}];
Show[p2, p1]
