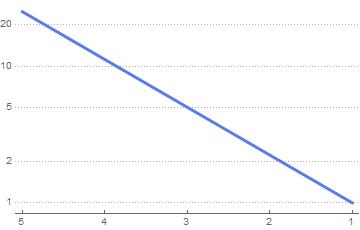
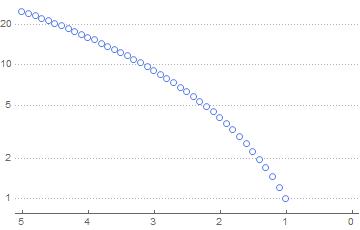
In Mathematica 10 try
Plot[x^2, {x, 1, 5}, PlotTheme -> "Business",
 ScalingFunctions -> {"Reverse", "Log"}, PlotRange -> All]

ListPlot[Table[{x, x^2}, {x, 1, 5, 0.1}], PlotTheme -> "Business",
 ScalingFunctions -> {"Reverse", "Log"}, PlotRange -> All]
