I am using Wolfram 14.0. And I would like the color of the bars in the BoxWhiskersChart to be identical to the colors in ListPlot. That is, in the BoxWhiskersChart, I would like the color of the box for dataset1 to be the orange color used in the ListPlot, and I would like the color of the box for dataset2 to be the blue color used in the ListPlot.
Try this:
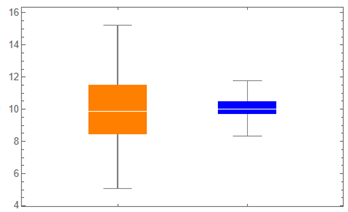
dataset1 = RandomVariate[NormalDistribution[10, 2], 100];
dataset2 = RandomVariate[TriangularDistribution[{8, 12}], 100];
BoxWhiskerChart[{dataset1 -> Orange, dataset2 -> Blue}]
Thank you! This is very helpful!!!
The default list of colors that get used for plotting multiple datasets appears to be the last "Indexed" color scheme, number 116. I can't find this documented anywhere though, so I don't know how likely this might be to change in the future. Here's a notebook that I think does what you're looking for: