I am using Wolfram 14.0. And I would like the color of the bars in the BoxWhiskersChart to be identical to the colors in ListPlot. That is, in the BoxWhiskersChart, I would like the color of the box for dataset1 to be the orange color used in the ListPlot, and I would like the color of the box for dataset2 to be the blue color used in the ListPlot.
The default list of colors that get used for plotting multiple datasets appears to be the last "Indexed" color scheme, number 116. I can't find this documented anywhere though, so I don't know how likely this might be to change in the future. Here's a notebook that I think does what you're looking for:
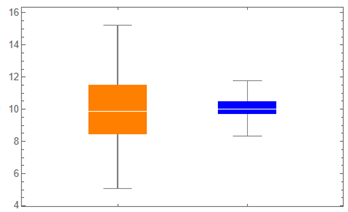
Try this:
dataset1 = RandomVariate[NormalDistribution[10, 2], 100];
dataset2 = RandomVariate[TriangularDistribution[{8, 12}], 100];
BoxWhiskerChart[{dataset1 -> Orange, dataset2 -> Blue}]
Thank you! This is very helpful!!!