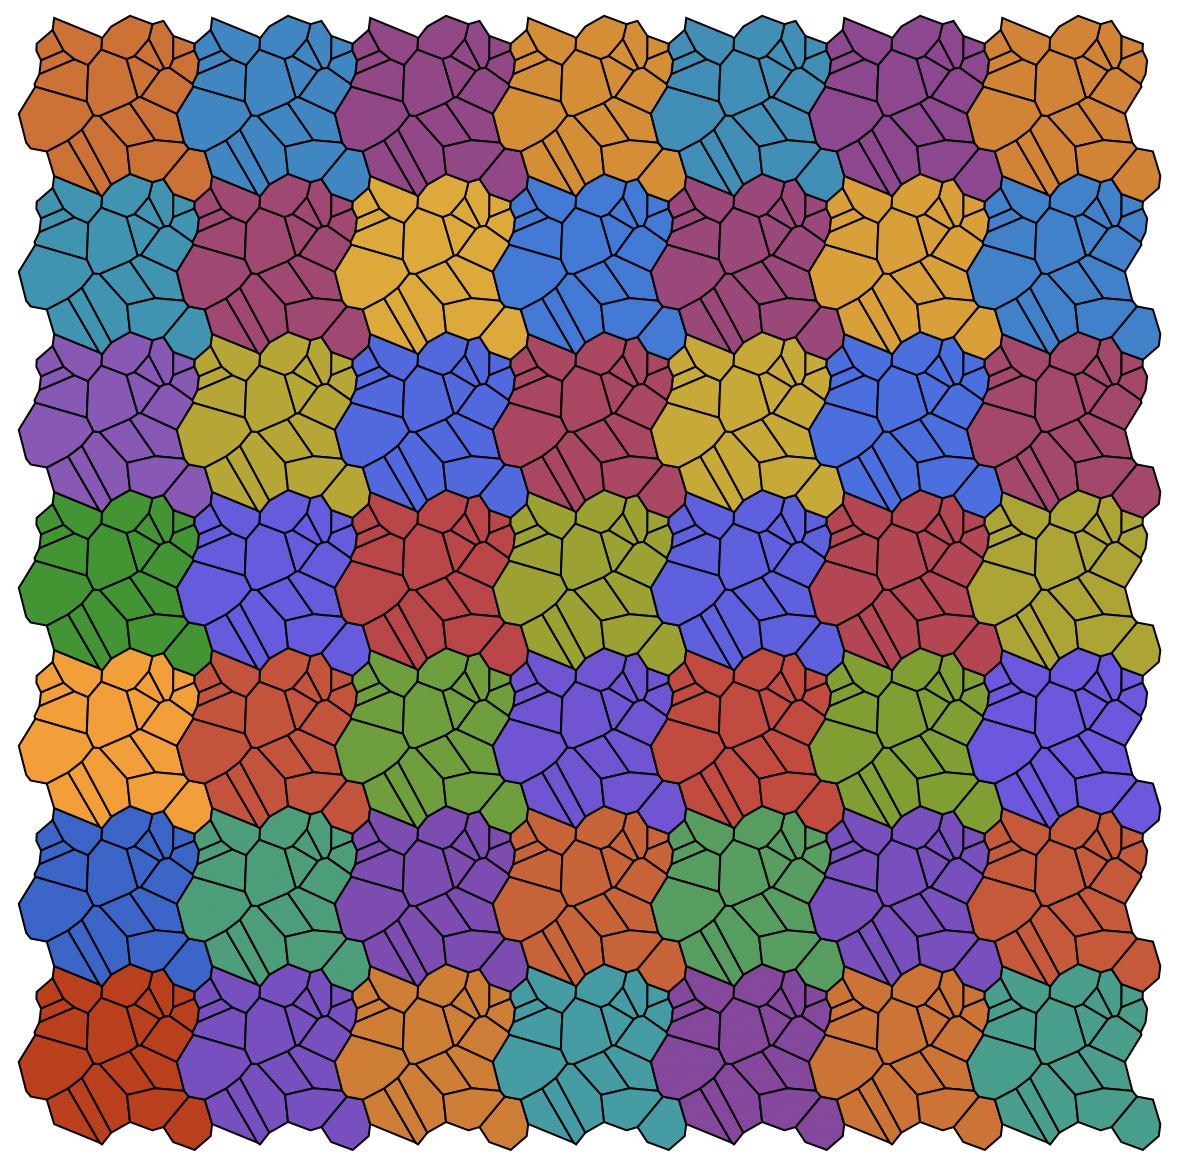
One way to periodically tile a Voronoi diagram is to translate your seeds in all directions you'd like to tile, find the Voronoi diagram of this set, then take the cells that correspond to the original data.
Here, I'll tile it in the cardinal directions.
Initial data:
SeedRandom[1];
pts = RandomReal[{-1, 1}, {20, 2}];
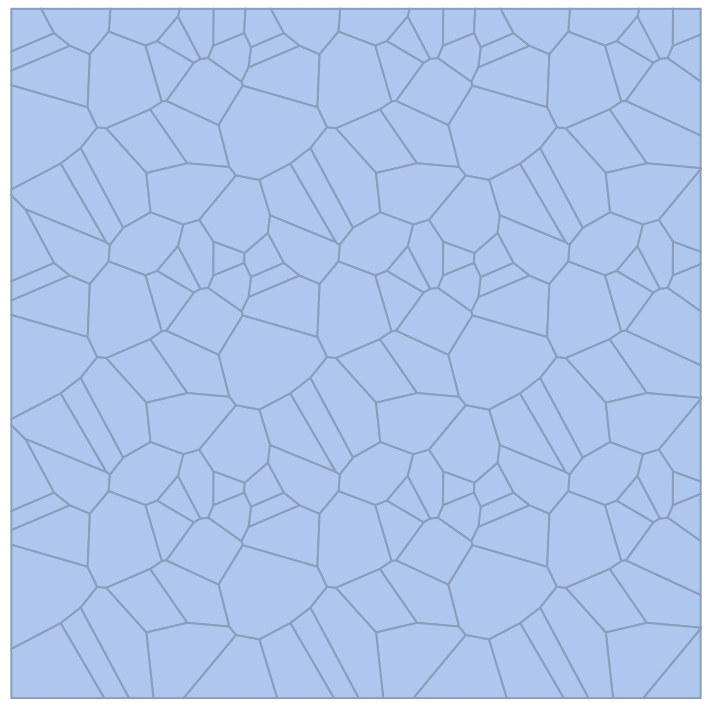
Now we augment this data and find a larger Voronoi mesh:
pts2 = Flatten[Table[TranslationTransform[{2 i, 2 j}][pts], {i, -1, 1}, {j, -1, 1}], 2];

vor = VoronoiMesh[pts2, {{-3, 3}, {-3, 3}}]
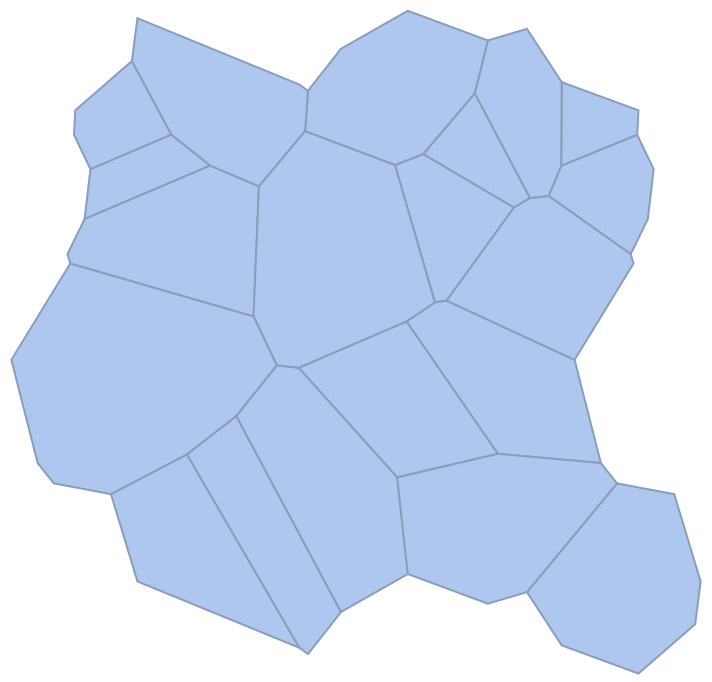
Now pick only the cells the original data lies in:
vcells = Catenate[NearestMeshCells[{vor, 2}, #] & /@ pts];

pvor = MeshRegion[MeshCoordinates[vor], MeshCells[vor, vcells]]
And tile:
Show[Table[
  MeshRegion[
    TransformedRegion[pvor, TranslationTransform[{2 i, 2 j}]],
    MeshCellStyle -> {1 -> Black, 2 -> ColorData[112, 7 i + j + 25]}
  ],
  {i, -3, 3}, {j, -3, 3}
]]
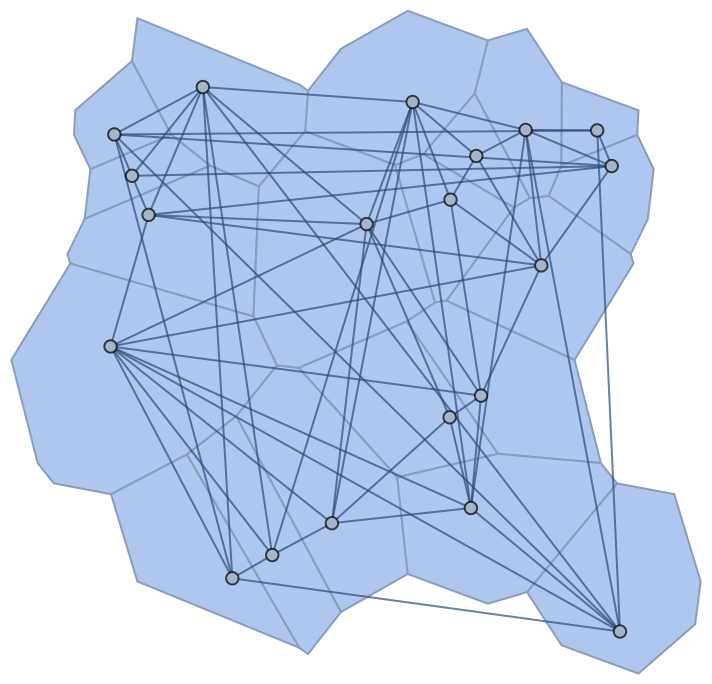
To get the periodic connectivity matrix, we can start with the connectivity matrix of the larger Voronoi, partition it into a 3x3 collection and sum them.
len = Length[pts];

C22 = #.Transpose[#]& @ vor["ConnectivityMatrix"[2, 1]];

cells = Region`Mesh`MeshMemberCellIndex[vor, pts2][[All, 2]];

C22perm = C22[[cells, cells]];

pC22 = SparseArray[Unitize[Total[Partition[Unitize[C22perm], {len, len}], 2]]];
pC22 -= IdentityMatrix[len, SparseArray];

Show[
  pvor,
  AdjacencyGraph[pC22, VertexCoordinates -> pts]
]