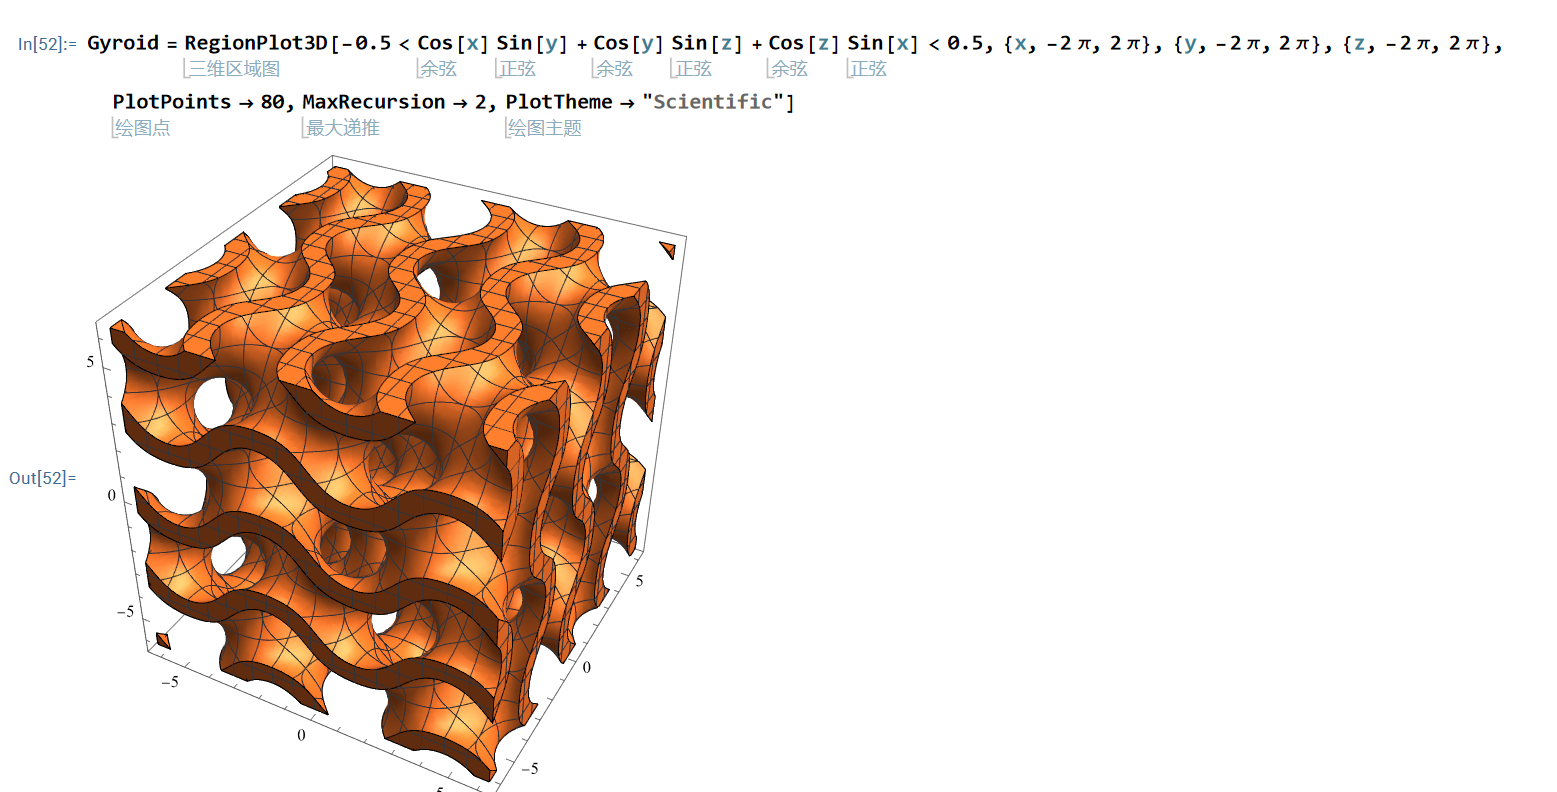
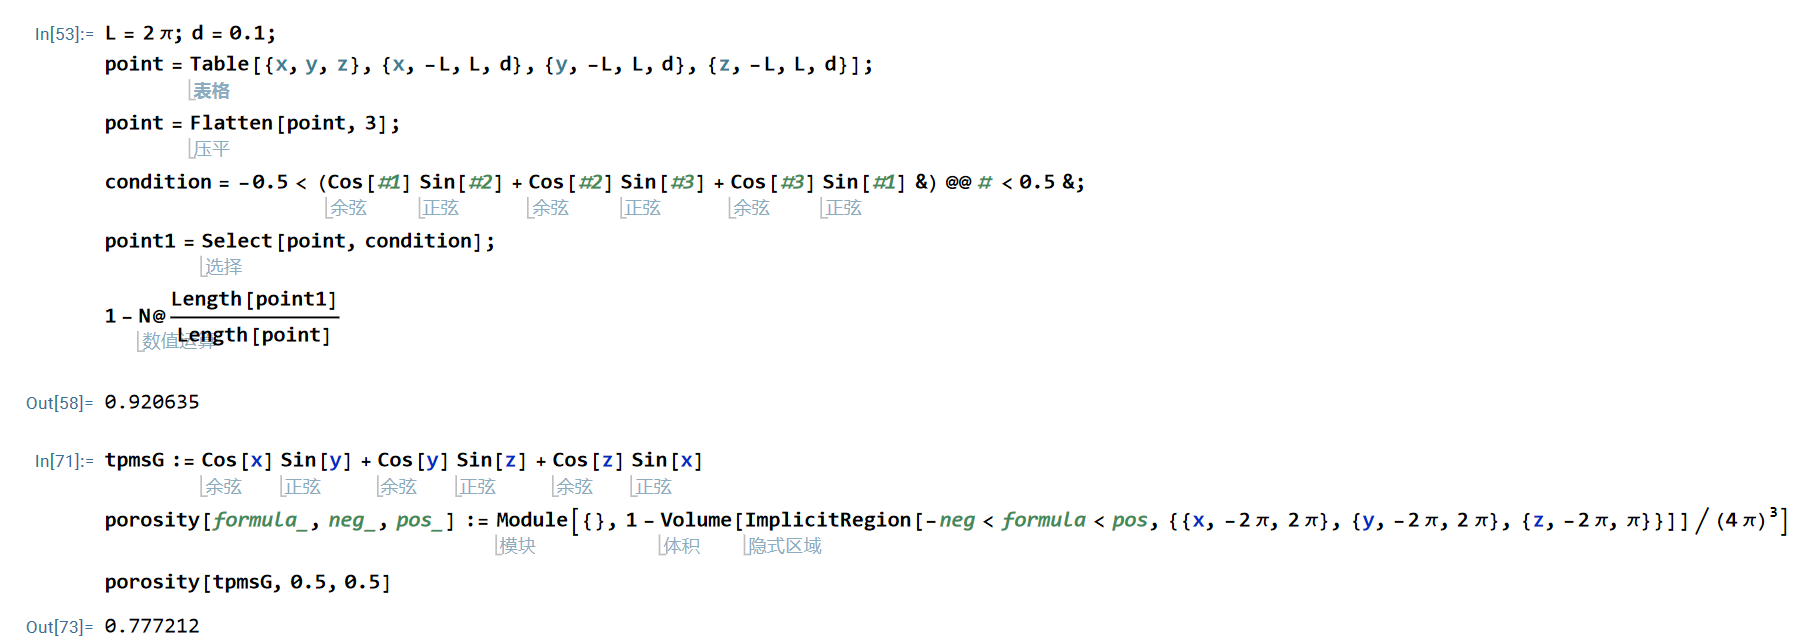
I now generate a three-dimensional model, using two methods to calculate the porosity, the first method is generated by the volume function, the second is calculated by the method of discrete mathematics, but I did not understand, the two results are not the same, is not my which method has a problem,
L = 2 \[Pi]; d = 0.1;
point = Table[{x, y, z}, {x, -L, L, d}, {y, -L, L, d}, {z, -L, L,
    d}];
point = Flatten[point, 3];
condition = -0.5 < (Cos[#1] Sin[#2] + Cos[#2] Sin[#3] +
        Cos[#3] Sin[#1] &) @@ # < 0.5 &;
point1 = Select[point, condition];
1 - N@(Length[point1]/Length[point])

tpmsG := Cos[x] Sin[y] + Cos[y] Sin[z] + Cos[z] Sin[x]
porosity[formula_, neg_, pos_] :=
 Module[{},
  1 - Volume[
     ImplicitRegion[-neg < formula <
       pos, {{x, -2 \[Pi], 2 \[Pi]}, {y, -2 \[Pi],
        2 \[Pi]}, {z, -2 \[Pi], \[Pi]}}]]/(4 \[Pi])^3]
porosity[tpmsG, 0.5, 0.5]
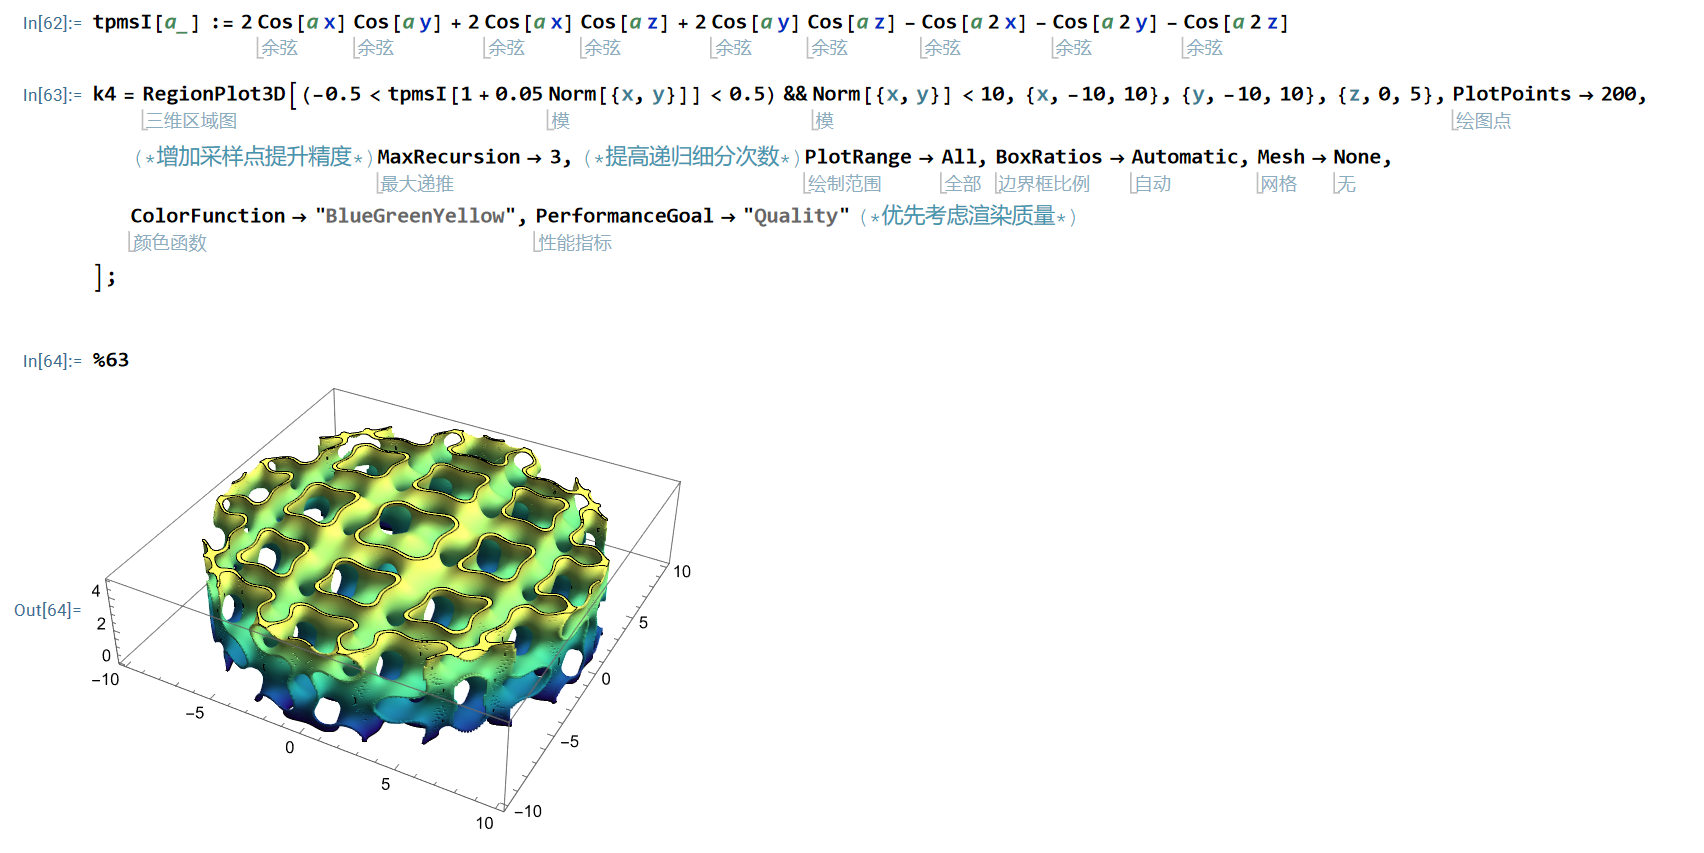
 After that, I generated a model of radial variation, which is its code. How can I calculate its porosity?