Message Boards Message Boards

1
|
11022 Views
|
1 Reply
|
2 Total Likes
View groups...
Share
Share this post:
GROUPS:

Topical Examples

Posted 11 years ago

Starting a discussion of news-related visualizations.

Votes in the UK are being counted today regarding Scottish independence, and relevant graphics would include maps depicting the potential split. Here's a basic approach, might be tough to get fancier within Twitter limits, but I encourage folks to try.

GeoGraphics[{GeoStyling[None],Polygon[=[uk]],GeoStyling[White],Polygon[AdministrativeDivisionData[=[scotland]]]}]
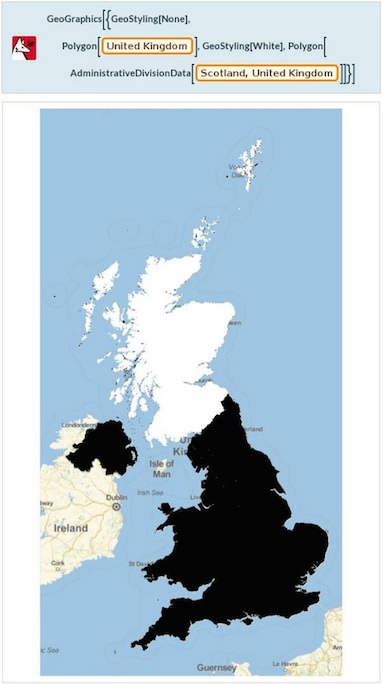
enter image description here

http://t.co/pb1YPl9YOK

POSTED BY: Andre Kuzniarek

And the followup result:

GeoGraphics[{GeoStyling[{"Image",#2}],Polygon[#1]}&@@EntityValue[=[uk],{"Entity","Flag"}],GeoBackground->Gray]

enter image description here

http://t.co/cixi5BHGI6

POSTED BY: Andre Kuzniarek
Reply to this discussion
Community posts can be styled and formatted using the Markdown syntax.
Reply Preview
Attachments
Remove
or Discard

Group Abstract Group Abstract