On September 18, Scotland held a referendum to answer the following question:
Should Scotland be an independent country?
The possible answers were 'Yes' or 'No' and the referendum would have passed with a simple majority vote (more than 50% 'Yes' votes).
In this post, I look at the results as published by the official referendum web site. As usual with this sort of analysis, there is a data import and normalization step, to get everything into a computable form, followed by various data analysis and visualization steps.
Data import and normalization
First, we get the entity for Scotland:
Scotland = SemanticInterpretation["Scotland"]

Next, we obtain the 32 Scottish council areas by accessing the "Subdivisions" property for Scotland. (For data consistency later on we also need to sort these council areas in a non-obvious way, which I do here by listing the elements in the order they need to be in):
CouncilAreas =
 Scotland["Subdivisions"][[{1, 2, 3, 4, 5, 13, 6, 7, 8, 9, 10, 11, 12,
     14, 15, 16, 17, 18, 19, 20, 21, 22, 23, 24, 25, 26, 27, 28, 29,
    30, 31, 32}]]

To get the voting results, we can simply copy and paste the table data from the official referendum web site. Here I only show the first three lines of this data and omit the rest with ...:
verificationTotals = ImportString["Aberdeen City\t175,751\t143,664\t81.7
  Aberdeenshire\t206,490\t180,045\t87.2
  Angus\t93,656\t80,300\t85.7
  ...","TSV"]

totalsByArea = ImportString["Aberdeen City\t143,664\t59,390\t84,094\t180
  Aberdeenshire\t180,045\t71,337\t108,606\t102
  Angus\t80,302\t35,044\t45,192\t66
 ...","TSV"]
We can now combine the council area entities from the Wolfram Knowledgebase with the data from the referendum web site. In this case I use MapThread to combine the three data sets and pick out the columns I need. I am building up a List of Associations which I then feed to the Dataset function which has useful database-like accessor functions:
dataset = Dataset[ MapThread[ Association[
 "CouncilArea" -> #1,
 "Electorate" -> #2[[2]],
 "TotalVotes" -> #3[[2]],
 "YesVotes" -> #3[[3]],
 "NoVotes" -> #3[[4]],
 "RejectedVotes" -> #3[[5]]] &,
 {CouncilAreas, verificationTotals, totalsByArea}
 ]]
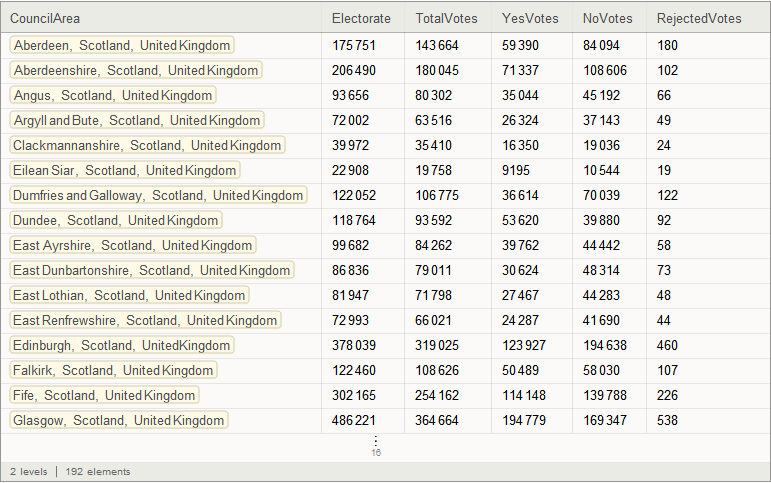
Now we're ready to have some fun.
Data analysis and visualization
First let's take a look at the number of Yes and No votes, from which we can conclude that the referendum did not pass (In other words, Scotland voted that it should not become an independent country):
dataset[Total, {"YesVotes","NoVotes"}]

The turnout for the referendum was very high. Let's take a look at the turnout (in %) by dividing the total votes cast by the size of the electorate:
turnout = dataset[All, Association[
"CouncilArea" -> Key["CouncilArea"][#],
"TurnOut" -> Quantity[N[100 Key["TotalVotes"][#]/Key["Electorate"][#]], "Percent"]
] &]
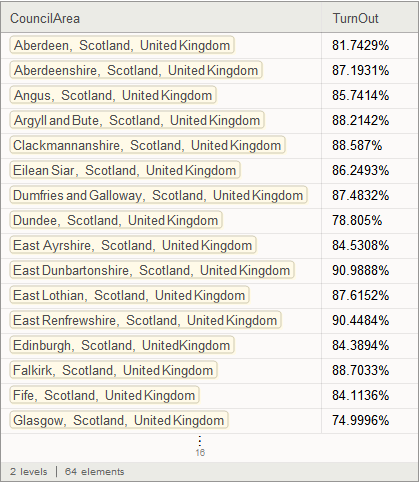
And now we can look at the lowest and highest turnouts:
turnout[SortBy[Key["TurnOut"]] /* First]

turnout[SortBy[Key["TurnOut"]] /* Last]

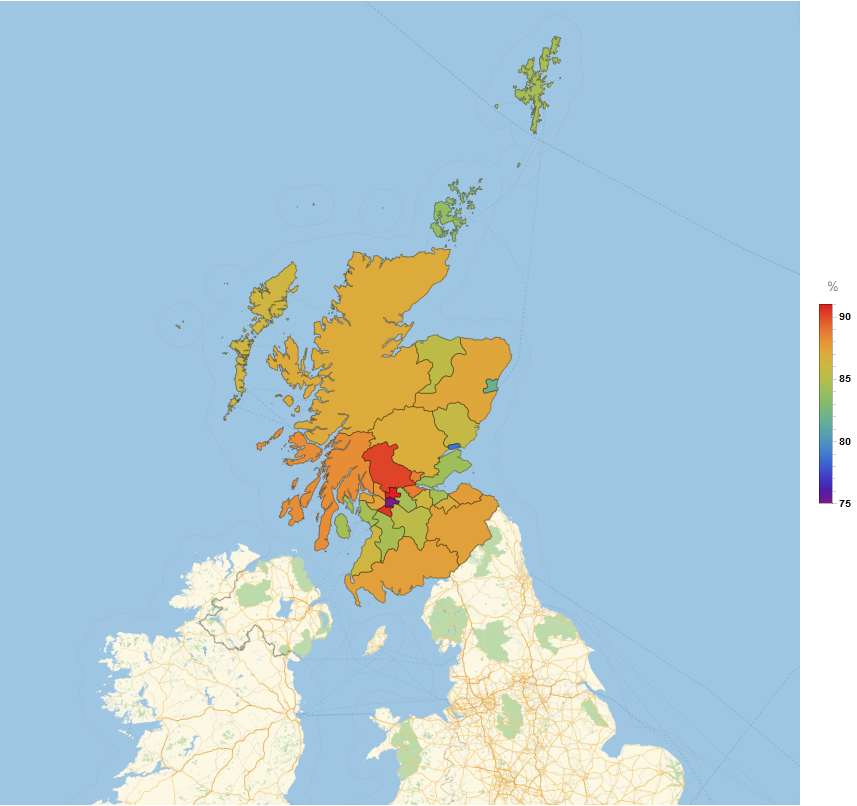
Or just visualize all the turnouts in a map centered on Scotland, with a 500km range:
GeoRegionValuePlot[
  turnout[All, Key["CouncilArea"][#1] -> Key["TurnOut"][#1] & ],
 GeoCenter ->   Entity["AdministrativeDivision", {"Scotland", "UnitedKingdom"}],
 GeoRange -> Quantity[500, "Kilometers"],
 ColorFunction -> "Rainbow"]
Now, let's take a look at the percentages of Yes votes by council area, which shows 4 council areas with a voting percentage of 50% or more 'Yes': Dundee, West Dunbartonshire, Glasgow, and North Lanarkshire:
yes = dataset[All, Association[
"CouncilArea" -> Key["CouncilArea"][#],
 "YesPercentage" -> Quantity[N[100 Key["YesVotes"][#]/Key["TotalVotes"][#]], "Percent"]
] &];

yes[SortBy[Key["YesPercentage"]] /* Reverse]
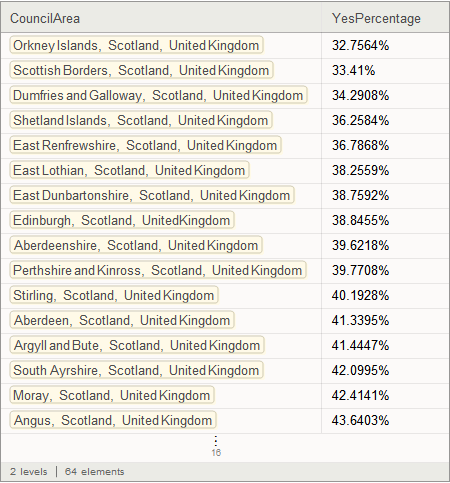
We can visualize this again with GeoRegionValuePlot. Here we use greens to indicate higher than 50% yes votes and pink to indicate lower than 50% yes votes. Darker hues indicate a greater distance from 50%:
GeoRegionValuePlot[
  yes[All, Key["CouncilArea"][#1] -> Key["YesPercentage"][#1] & ],
  GeoCenter ->   Entity["AdministrativeDivision", {"Scotland", "UnitedKingdom"}],
  GeoRange -> Quantity[500, "Kilometers"],
  ColorFunction -> Function[{c}, Module[{e = QuantityMagnitude[c]}, If[e < 50, Darker[Pink, (50 - e)/50], Darker[Green, (e - 50)/15]]]],
ColorFunctionScaling -> False, ImageSize -> 800]
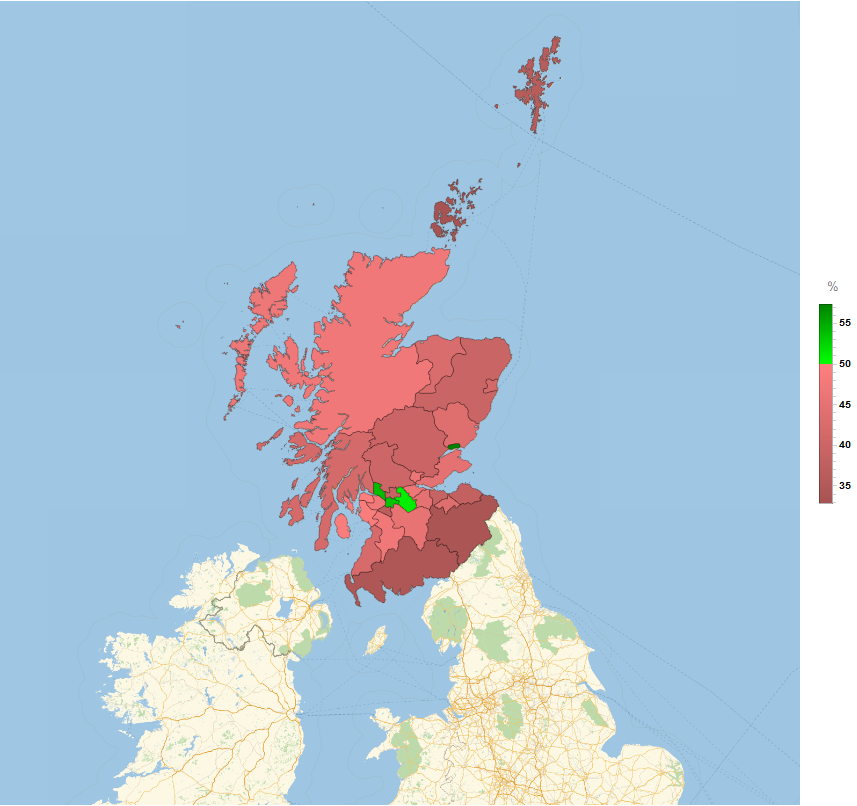
It is interesting to see how the council areas bordering England (Scottish Borders and Dumfries and Galloway) are least interested in independence.