Hi everyone,
This may be a bit of a niche request, but I'm fascinated by the visual style of the plots on functions.wolfram.com, particularly in how they render mathematical functions.
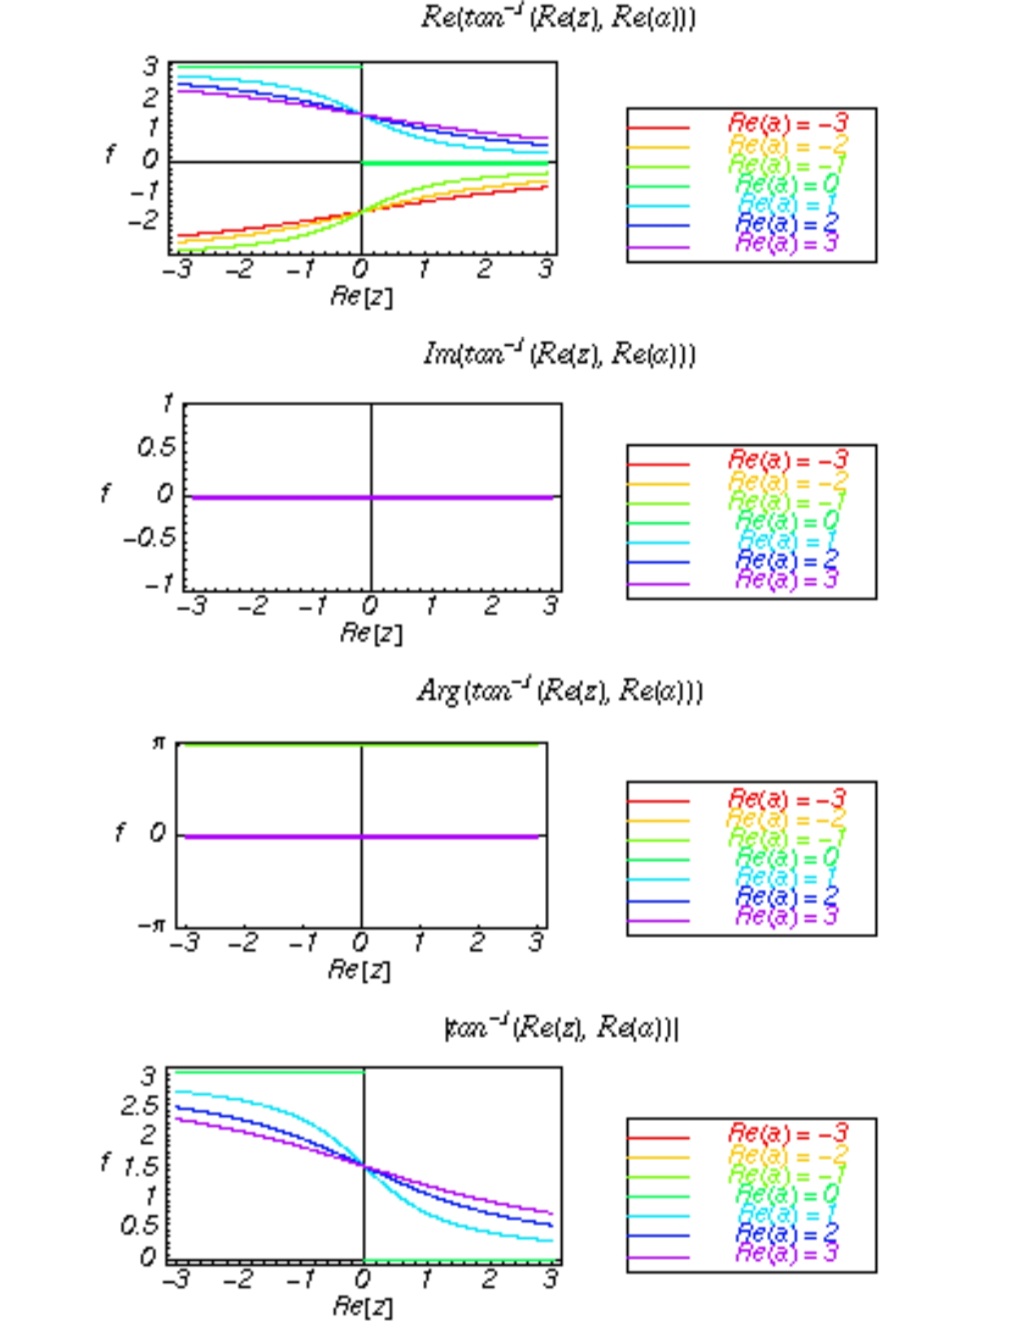
What I love about them is that they have a clear, aliased look (almost retro, lol) with: - Crisp edges and visible pixelation
No (or minimal) antialiasing on curves and fonts
Clean axes with or without frames
Simple, sharp legends using rainbow-colored lines
Classic sans-serif fonts (looks like Helvetica or something similar)
Here’s an example of what I’m referring to:
What I've tried so far
I've experimented with:
Adjusting FontFamily and TicksStyle to mimic the labels
Using Rasterize[plot, ImageResolution -> low], but this introduces unwanted blurring, even at low resolution X.
Tweaking PlotPoints and PerformanceGoal -> "Speed" to reduce smoothing, bit blurry.
Exporting to high-res and then using ImageResize[..., Resampling -> "Nearest"] this gives me closer to the aliased look, but feels a bit hacky...
Thanks in advance for any ideas!


