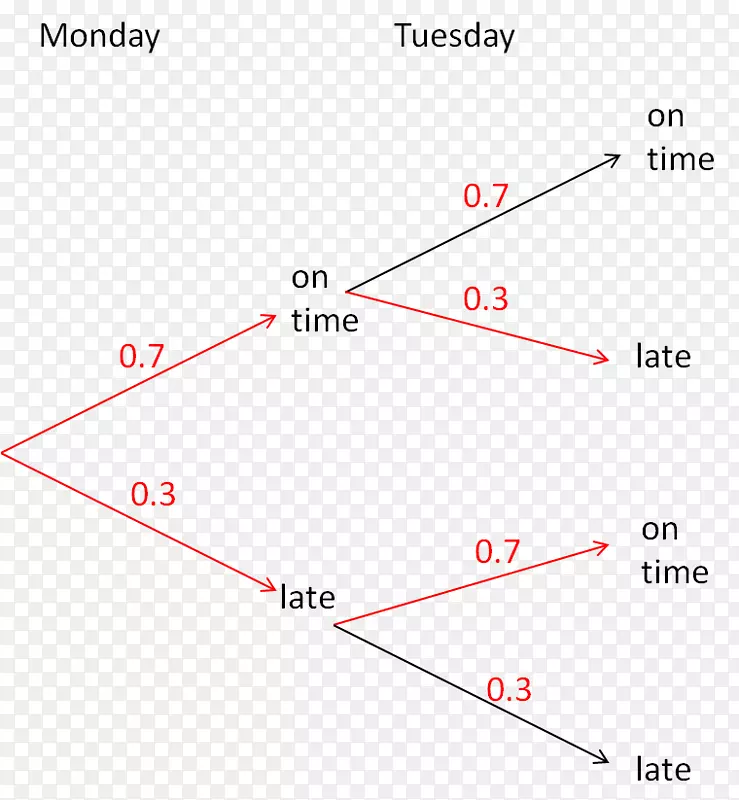
How to use Mathematica code to effectively draw the probability tree diagram as shown in the following image?
vertices = {"Start", "Monday", "Tuesday", "Mon-OnTime", "Mon-Late",
   "Tue-OnTime", "Tue-Late"};
edges = {{"Start" -> "Monday", "Monday (0.5)"}, {"Start" -> "Tuesday",
     "Tuesday (0.5)"}, {"Monday" -> "Mon-OnTime",
    "OnTime (0.7)"}, {"Monday" -> "Mon-Late",
    "Late (0.3)"}, {"Tuesday" -> "Tue-OnTime",
    "OnTime (0.7)"}, {"Tuesday" -> "Tue-Late", "Late (0.3)"}};


TreePlot[edges[[All, 1]],
 VertexLabels -> {"Start" -> "Start", "Monday" -> "Monday",
   "Tuesday" -> "Tuesday", "Mon-OnTime" -> "OnTime",
   "Mon-Late" -> "Late", "Tue-OnTime" -> "OnTime",
   "Tue-Late" -> "Late"},
 EdgeLabels -> Thread[edges[[All, 1]] -> edges[[All, 2]]],
 DirectedEdges -> True, ImageSize -> 500, PlotStyle -> {Black, Thick},
  VertexLabelStyle -> 14, EdgeLabelStyle -> {Blue, Italic, 12}]


