Group Abstract Group Abstract

Message Boards Message Boards

0
|
398 Views
|
4 Replies
|
2 Total Likes
View groups...
Share
Share this post:

PlotLegends not showing for individual equations in ContourPlot

Posted 1 month ago
ContourPlot[Evaluate@{#}, {x, -5, 10}, {y, -8, 10}, 
       AxesOrigin -> {0, 0}, Frame -> False, Axes -> True, 
       AxesOrigin -> {0, 0}, PlotLegends -> Automatic, 
       Epilog -> {{Purple, 
          Line[{{0, 0}, 
            pt = CoefficientArrays[#, {x, y}][[-1]] // Normal}]}, {Red, 
          PointSize@0.02, Point[pt]}}] & /@ (ls = {x + 2 y - 5 == 0, 
        2 x - 3 y - 6 == 0, 2 x - 3 y + 6 == 0, 
        3 x - 8 y - 10 == 0, -3 x - 7 y + 8 == 0, -3 x - 7 y - 8 == 0})
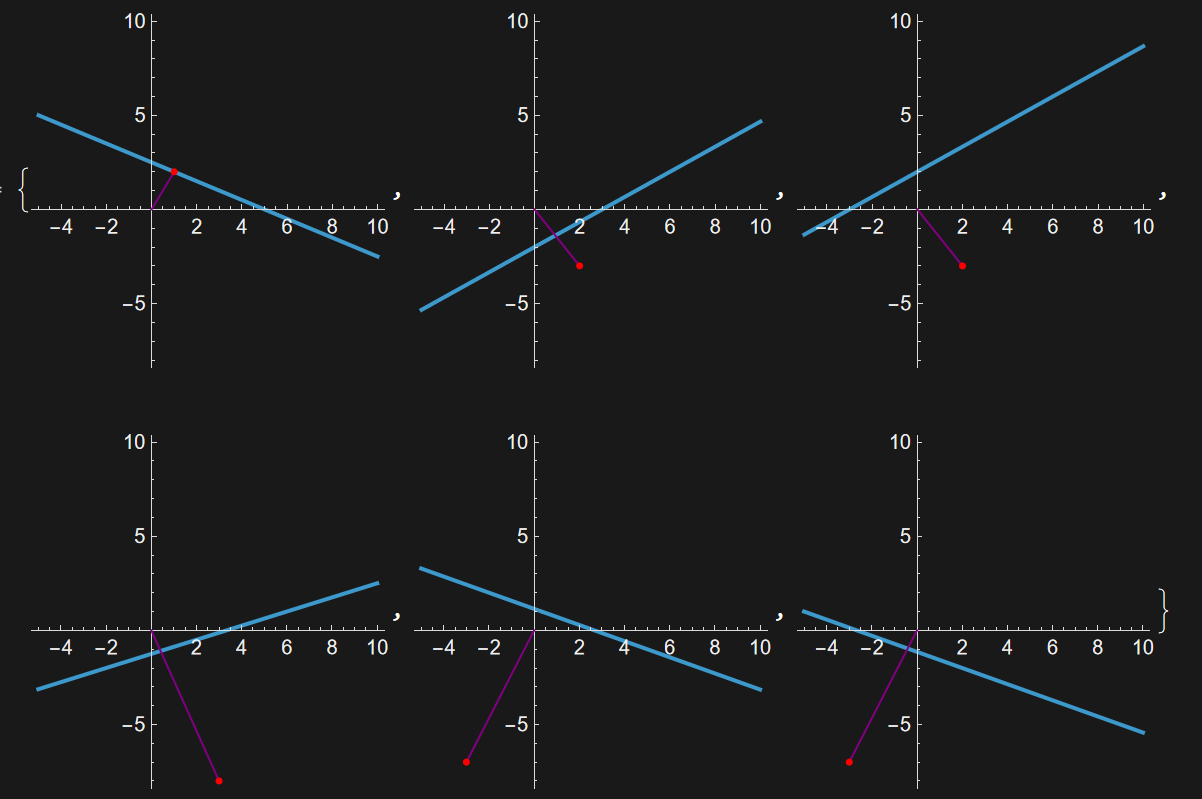
enter image description here

PlotLegends Not Showing for Individual Equations in Mathematica ContourPlot

POSTED BY: Wen Dao
4 Replies

Another way is with PlotLegends -> "AllExpressions"

In the documentation for PlotLegends, the section on Possible Issues makes no sense, at least in recent versions of Mathematica.

POSTED BY: Gianluca Gorni
Posted 1 month ago

This works too. Cheers.

POSTED BY: Wen Dao

Try PlotLegends -> {#}. The Automatic setting seems to produce no legend if there is only one equation being plotted. That behavior does not seem to be documented. I don't know if it's intentional or a bug.

POSTED BY: Michael Rogers
Posted 1 month ago

Thank you! This method solved the problem!

POSTED BY: Wen Dao
Reply to this discussion
Community posts can be styled and formatted using the Markdown syntax.
Reply Preview
Attachments
Remove
or Discard