ContourPlot[Evaluate@{#}, {x, -5, 10}, {y, -8, 10},
       AxesOrigin -> {0, 0}, Frame -> False, Axes -> True,
       AxesOrigin -> {0, 0}, PlotLegends -> Automatic,
       Epilog -> {{Purple,
          Line[{{0, 0},
            pt = CoefficientArrays[#, {x, y}][[-1]] // Normal}]}, {Red,
          PointSize@0.02, Point[pt]}}] & /@ (ls = {x + 2 y - 5 == 0,
        2 x - 3 y - 6 == 0, 2 x - 3 y + 6 == 0,
        3 x - 8 y - 10 == 0, -3 x - 7 y + 8 == 0, -3 x - 7 y - 8 == 0})
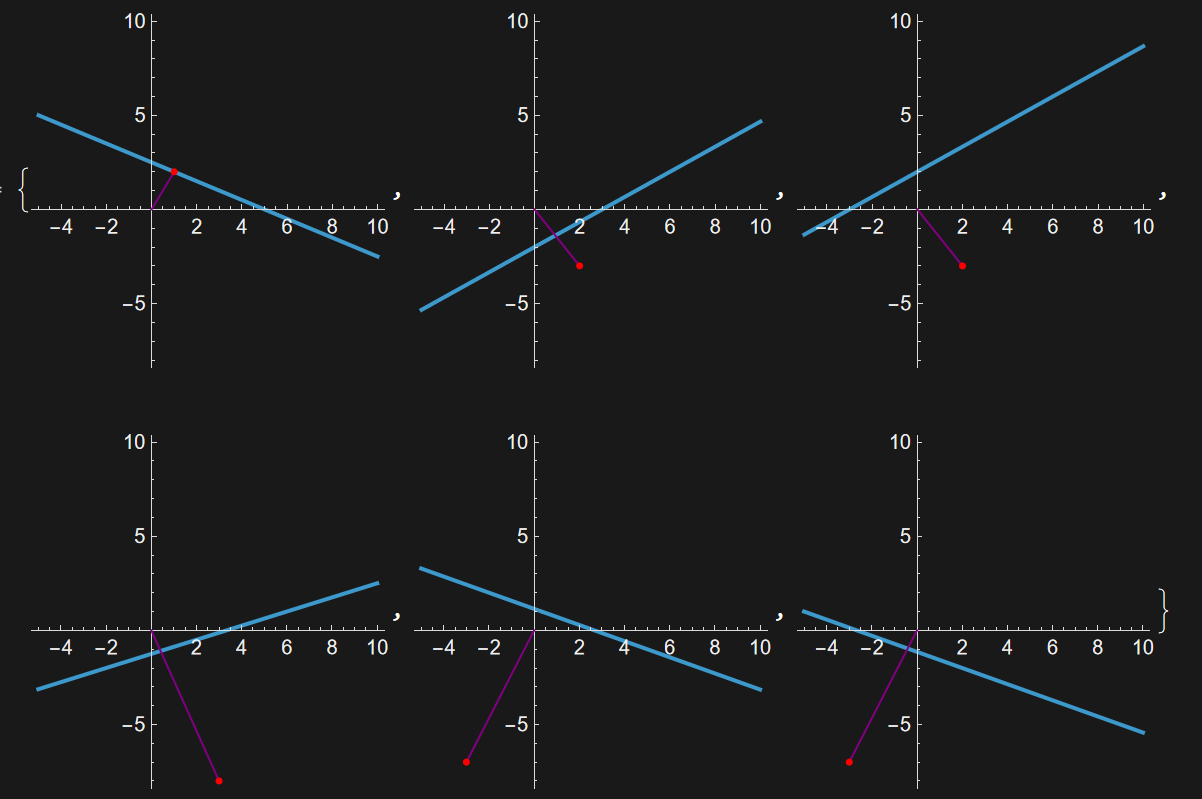
PlotLegends Not Showing for Individual Equations in Mathematica ContourPlot


