The new augmented reality - ARPublish - functionality seems to have an amazing potential. It is not just a fun exercise, but may also become an extremely valuable fancy tool for companies and entrepreneurs.
For example I am trying to ARPublish a Graph3D that represents the internal structure of a complex website. It was relatively easy to find all the relationships among the php source files and build a graph of them. However, when I ARPublish it, I cannot see the VertexLabels.
I can give a couple of minimal code examples:
Graph3D[Rule @@@
  RandomSample[Tuples[Join[RandomWord[4], ToString /@ Range[3]], {2}],
    20], VertexLabels -> Automatic]
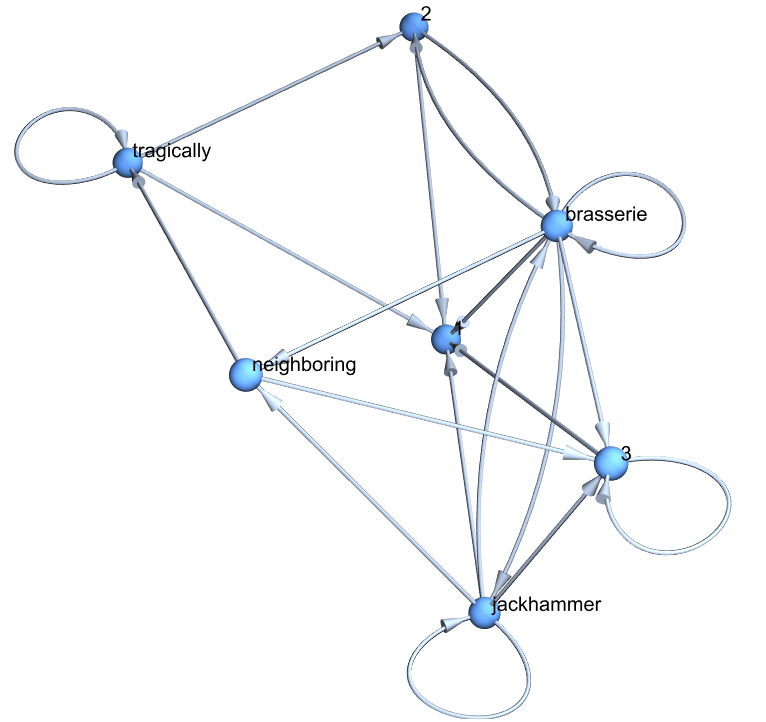
ARPublish[%]

URL: AR graph 1
Also using Annotation:
Graph3D[Table[
      Annotation[
       v, {VertexSize -> 0.2 + 0.2 Mod[v, 5],
        VertexStyle -> Hue[v/15, 1, 1], VertexLabels -> Automatic}], {v,
       0, 14}], Table[v \[UndirectedEdge] Mod[v + 1, 15], {v, 0, 14}]]
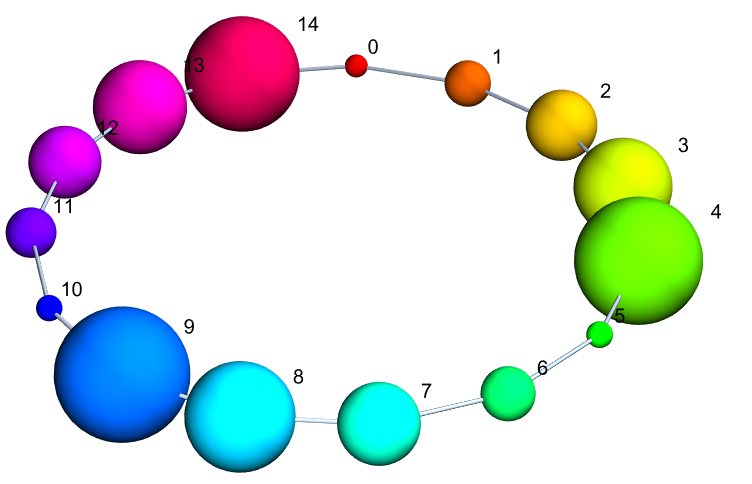
ARPublish[%]

URL: AR graph 2
In both these simple cases, the VertexLabels do not appear in the augmented reality published object, as seen from my iPhone 14.
In real world applications labels and additional information (well provided in notebooks by the Tooltip functionality) would be what make the augmented reality visualization really useful.
Does anyone know how to show Graph3D VertexLabels in ARPublish?
Thank you in advance.


