Another way to do it
Needs["NumericalCalculus`"]

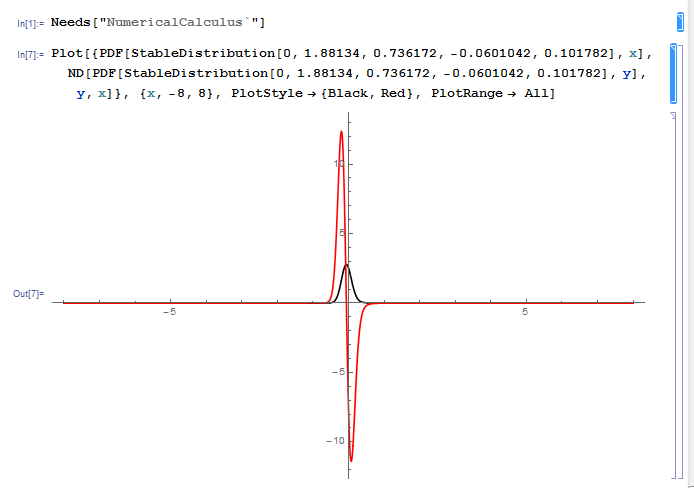
Plot[{PDF[StableDistribution[0, 1.88134, 0.736172, -0.0601042, 0.101782], x],
   ND[PDF[StableDistribution[0, 1.88134, 0.736172, -0.0601042, 0.101782], y], y, x]},
{x, -8, 8}, PlotStyle -> {Black, Red}, PlotRange -> All]
observe the usage of variables in the numerical approximation of the derivative, if done wrong, the plot is utterly silly, i.e. constant.
