Message Boards Message Boards

0
|
4822 Views
|
3 Replies
|
1 Total Likes
View groups...
Share
Share this post:

Compute the derivative of the PDF of a StableDistribution

Hi to everyone,

I would like to evaluate somehow the derivative of the PDF of a StableDistribution in Mathematica 10, namely

D[PDF[StableDistribution[0, 1.88134, 0.736172, -0.0601042, 0.101782], x],x]

numerically or by other means. I would like to plot it (say, in the interval {x,-8,8}) alone and combined with other functions that I know how to plot and evaluate.

Thanks in advance!

POSTED BY: Arturo Ramos
3 Replies

Thanks Udo,

Your solution works very well for me and it is more elegant; it serves as well for other cases under study without specific changes. I tried ND before but I did not know that a package had to be loaded...

Thanks again, and best wishes.

POSTED BY: Arturo Ramos

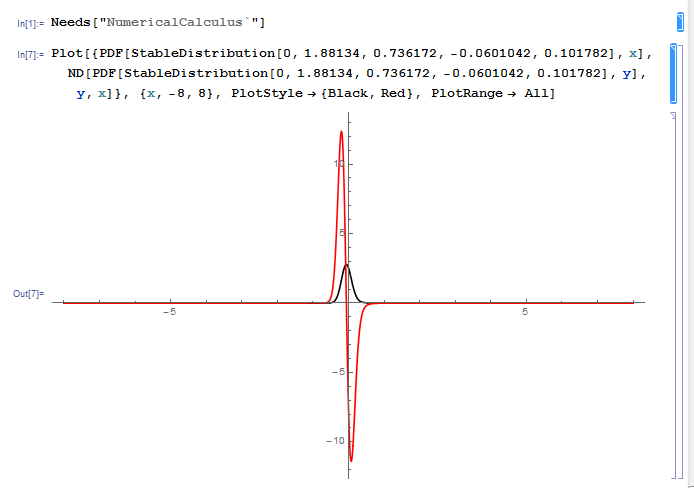
Another way to do it

Needs["NumericalCalculus`"]

Plot[{PDF[StableDistribution[0, 1.88134, 0.736172, -0.0601042, 0.101782], x],
   ND[PDF[StableDistribution[0, 1.88134, 0.736172, -0.0601042, 0.101782], y], y, x]}, 
{x, -8, 8}, PlotStyle -> {Black, Red}, PlotRange -> All]

observe the usage of variables in the numerical approximation of the derivative, if done wrong, the plot is utterly silly, i.e. constant.

enter image description here

POSTED BY: Udo Krause

I have found a way to do it, by means of the simple idea of approximating a derivative by the quotient of increments when the increment of the variable x is very small. It works very well and the graph is quite good.

Thanks to everyone anyway.

POSTED BY: Arturo Ramos
Reply to this discussion
Community posts can be styled and formatted using the Markdown syntax.
Reply Preview
Attachments
Remove
or Discard

Group Abstract Group Abstract