You are right, I did a mistake in my statement. the interval is for both [-pi,pi]. on x=-1 and y=1, both softwares give same value 3pi/4.
My problem is as follow:
I'm trying to convert a polar function Psi(r,theta) in cartesian coordinates to do a mapping.
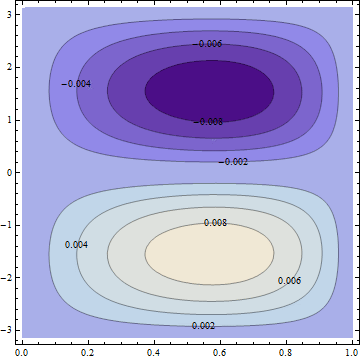
ContourPlot[\[Psi][r, \[Theta]], {r, 0, 1}, {\[Theta], -Pi, Pi},
 Contours -> {-0.008, -0.004, -0.006, -0.002, 0.002, 0.004, 0.006,
   0.008}, PlotPoints -> 30, ContourLabels -> All]
Which gives this contourplot : theta in vertical axis, radius in horizontal axis.

But when I convert it into Cartesian, there is any loop, the contour plot is completely different and the result is wrong.
r = Sqrt[x^2 + y^2]; \[Theta] = ArcTan[x, y];
ContourPlot[\[Psi][x, y], {x, -1, 1}, {y, -1, 1}, PlotPoints -> 30,
 AxesLabel -> Automatic,
 Contours -> {-0.008, -0.004, -0.006, -0.002, 0.002, 0.004, 0.006,
   0.008}, PlotPoints -> 30, ContourLabels -> All]
It seems it depends on the quadrant and is in the range [-Pi/2,Pi/2].
![Psi[x,y] in cartesian coordinates](/c/portal/getImageAttachment?filename=function-cartesian.gif&userId=341358)
When I plot this function in Scilab, no more problem, I have 2 nice loops.
That's why, I said the problem is likely from the ArcTan[x,y] I'm using during the conversion polar->Cartesian.
How to do this? I'm sure it is pretty easy to solve it.