Message Boards Message Boards

0
|
13316 Views
|
4 Replies
|
1 Total Likes
View groups...
Share
Share this post:
GROUPS:

atan(y,x) scilab vs. ArcTan[x,y] mathematica

Posted 11 years ago

Hi everyone, I try to convert a polar plot into cartesian plot. I have a problem with the conversion of the azimuthal angle. I work on [-pi,pi] and I'm in struggle with the inverse tangent function. I stopped to do this on Mathematica and used Scilab for this task. it works well on Scilab but I still want to understand the difference. Hope you can give me a hint. :) The main problem is the conversion between Atan(y,x) (similar to atan2 in Fortran) and ArcTan[x,y]. In Scilab, Atan(y,x) computes the 4-quadrant arctangent. It returns the argument (angle) of the complex number x+i*y. The range of atan(y,x) is [-pi, pi]. But in Mathematica, ArcTan(x,y) computes the 4-quadrant arctangent. It returns the argument (angle) of the complex number x+i*y. BUT the range of ArcTan(x,y) is [-pi/2, pi/2]. I browse in Internet and cannot find a clear statement about the conversion between atan(y,x) and Arctan[x,y]. I tried many piecewise-functions for x>0 and x<0 but still no success. Thanks in advance for the support.

POSTED BY: afreeka b
4 Replies

Need to argument form of ArcTan returns angle values between minus pi and pi. Try

ArcTan[-1,1]

The statement that you are quoting from the documentation is referring to the single argument form.

POSTED BY: David Reiss
Posted 11 years ago

You are right, I did a mistake in my statement. the interval is for both [-pi,pi]. on x=-1 and y=1, both softwares give same value 3pi/4. My problem is as follow: I'm trying to convert a polar function Psi(r,theta) in cartesian coordinates to do a mapping.

ContourPlot[\[Psi][r, \[Theta]], {r, 0, 1}, {\[Theta], -Pi, Pi}, 
 Contours -> {-0.008, -0.004, -0.006, -0.002, 0.002, 0.004, 0.006, 
   0.008}, PlotPoints -> 30, ContourLabels -> All]

Which gives this contourplot : theta in vertical axis, radius in horizontal axis.
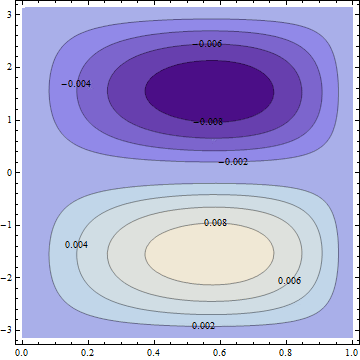
Psi [r,theta in polar coordinates

But when I convert it into Cartesian, there is any loop, the contour plot is completely different and the result is wrong.

r = Sqrt[x^2 + y^2]; \[Theta] = ArcTan[x, y];
ContourPlot[\[Psi][x, y], {x, -1, 1}, {y, -1, 1}, PlotPoints -> 30, 
 AxesLabel -> Automatic, 
 Contours -> {-0.008, -0.004, -0.006, -0.002, 0.002, 0.004, 0.006, 
   0.008}, PlotPoints -> 30, ContourLabels -> All]

It seems it depends on the quadrant and is in the range [-Pi/2,Pi/2].

Psi[x,y] in cartesian coordinates

When I plot this function in Scilab, no more problem, I have 2 nice loops. That's why, I said the problem is likely from the ArcTan[x,y] I'm using during the conversion polar->Cartesian. How to do this? I'm sure it is pretty easy to solve it.

POSTED BY: afreeka b

Difficult to say much without complete code e.g. a definition of the actual function psi[t,theta]. My guess is you want to define

r[x_,y_]: Sqrt[x^2 + y^2]
theta[x_,y_]:= ArcTan[x, y]

and then plot ContourPlot[\[Psi][r[x,y],theta[x,y]],....

POSTED BY: Daniel Lichtblau
Posted 11 years ago

Fantastic,it works. I knew it was a small mistake. I spend so many times on it. FYI, the function Psi is quite long and complicated to write as it is a Thebychev-Fourier serie. Many thanks.

POSTED BY: afreeka b
Reply to this discussion
Community posts can be styled and formatted using the Markdown syntax.
Reply Preview
Attachments
Remove
or Discard

Group Abstract Group Abstract