Not quite sure of what you want, but if you want to see a preditor-prey population pair evolve over time, you can use ParametricPlot, yes. The whole eigenvector business is just turning the matrix arithmetic into scalar arithmetic, which means you can use a simple variable in your ParametricPlot.
Block[
 {k},
 With[
  {m = {{6/10, 1/2}, {-7/40, 6/5}}},
  {initialPopulations = {20, 50}},
  {es = Eigensystem[m]},
  {lc = SolveValues[k . es[[2]] == initialPopulations, k \[Element] Vectors[2, Reals]]},
  populationFn = Function[t, Total[es[[1]]^t lc[[1]] es[[2]]]]]]
Demonstration:
populationFn[6.5] // N
(* {80.7071, 69.0127} *)
(* about 81 foxes and about 69 rabbits *)

ParametricPlot[populationFn[t], {t, 0, 10}]
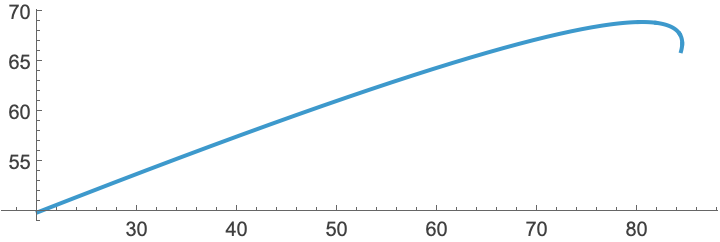
Explanation:
You don't necessarily need the Block, but I'm using the variable k in the Solve, and I just want to avoid a conflict.
The m is simply your predator-prey discrete dynamical system. initialPopulations is just an initial condition that I made up: 20 foxes and 50 rabbits. We need an initial value before we can solve for the linear combination of eigenvectors that we'll be using.
I'm using Eigensystem as a shortcut rather than calculating the eigenvectors and eigenvalues separately.
The lc is the linear combination of the eigenvectors that give the initial value.
The output is a function, and we can plug it into ParametricPlot. I'm just doing the standard arithmetic inside the Function. Note how we've moved from applying the matrix to do updates to just using scalars.
This doesn't look like the picture you posted, but I'm not sure what you were going for anyway. Ask follow ups if this doesn't help.



