I am working on a series of data visualizations I intend to publish as a tweet storm recognizing Pixar's 30th feature film. The first visualization of the series is going to be a TimeLinePlot of the 1-sheet poster for all Pixar movies. I have been running into an odd challenge with spacing of the graphics. If I accept low resolution images, the posters line up like I want them to. That leaves them barely legible. If I increase the resolution, the bounding boxes are so large the layout is unusable.
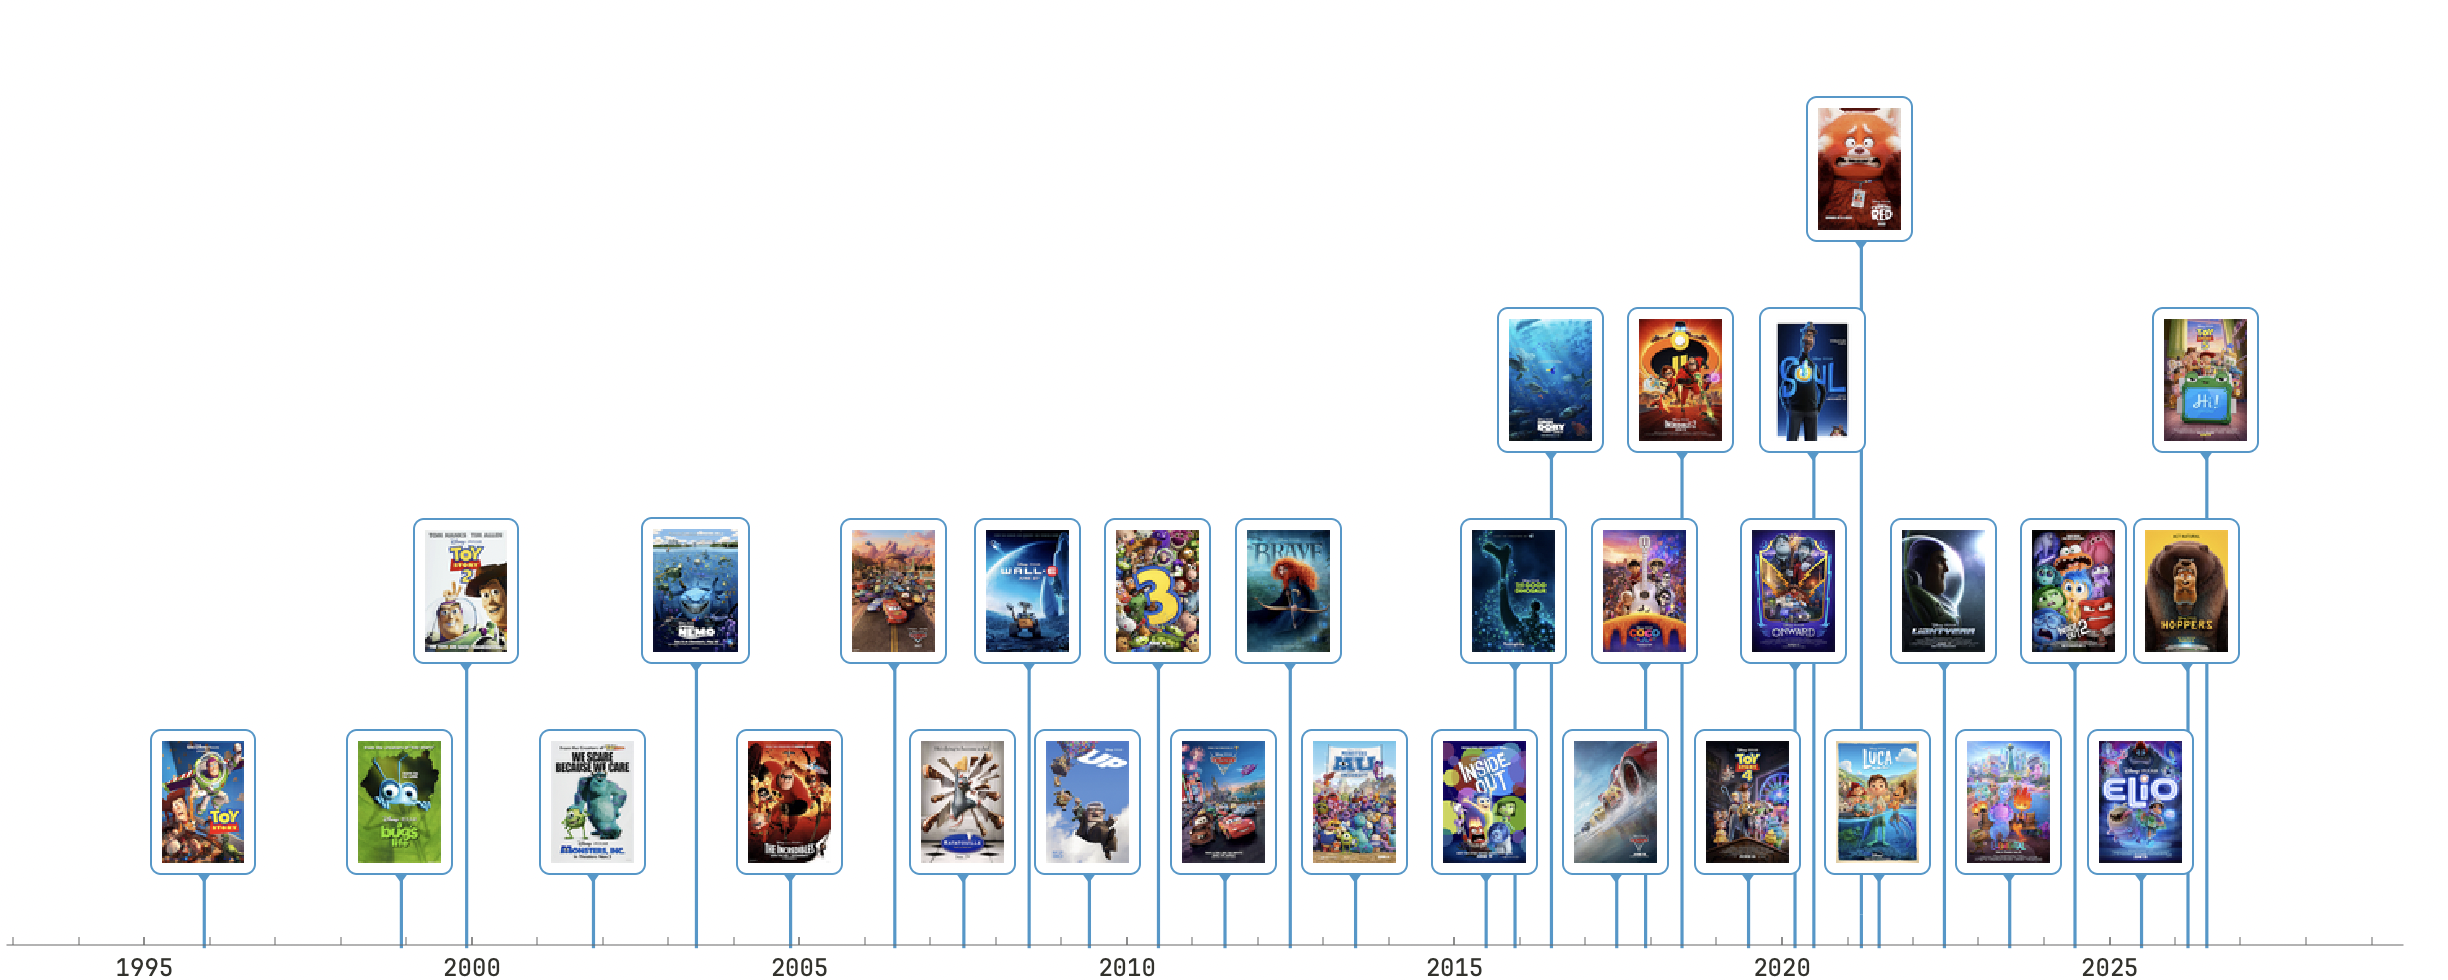
Here is an example of what I would like them to look like. Note the low resolution making the individual posters hard to identify:
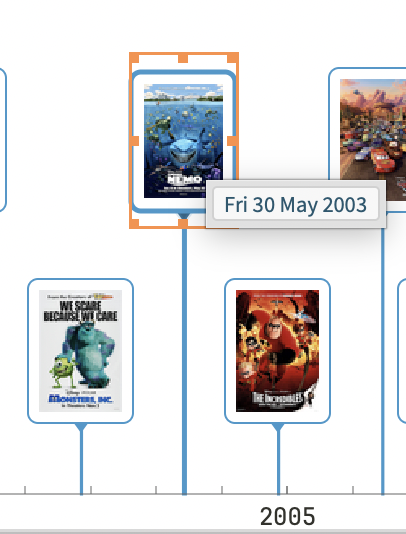
And here you can see the bounding box with low resolution images. Its not perfect but I can accept it:
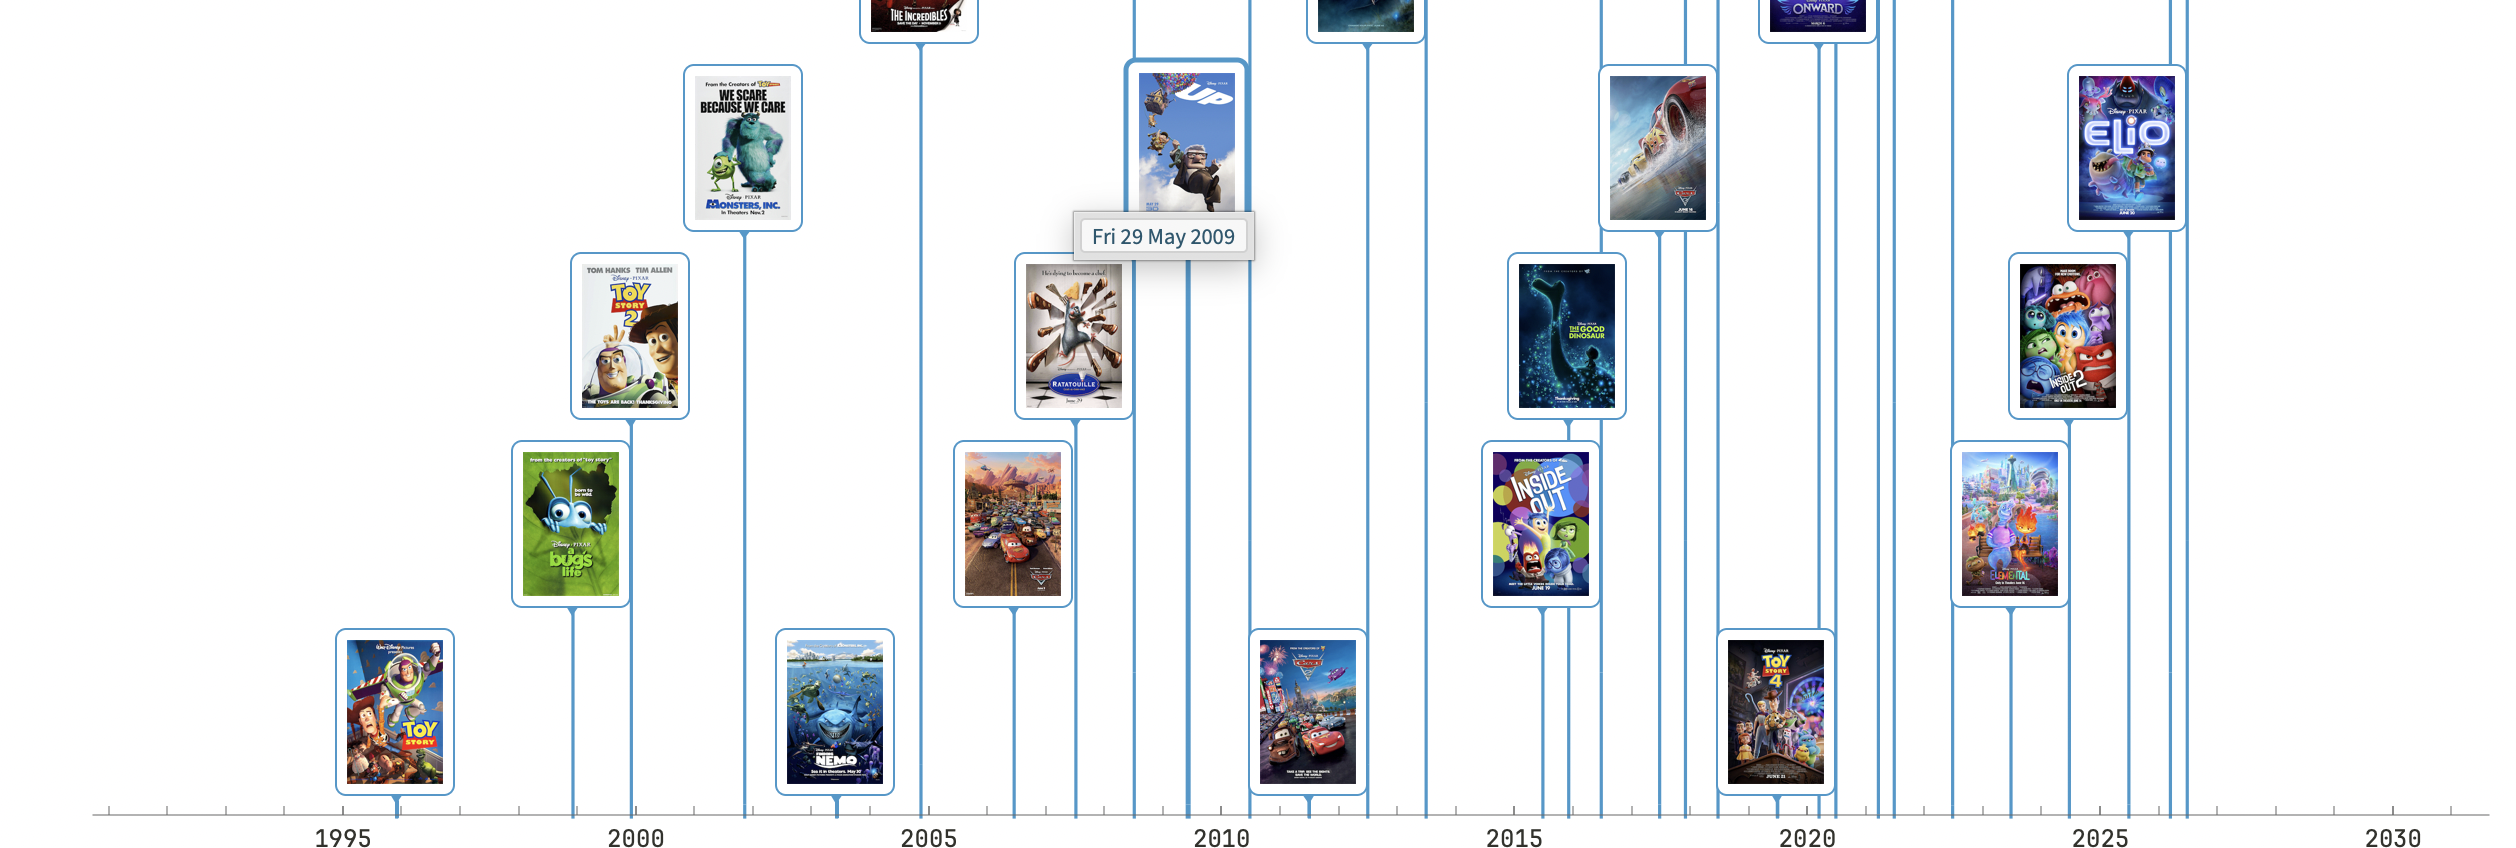
Now switching to using a higher resolution option. This is the best I can get the formatting to look, but the posters are identifiable even at a small size.:
The problem becomes clear when I look at the bounding boxes:
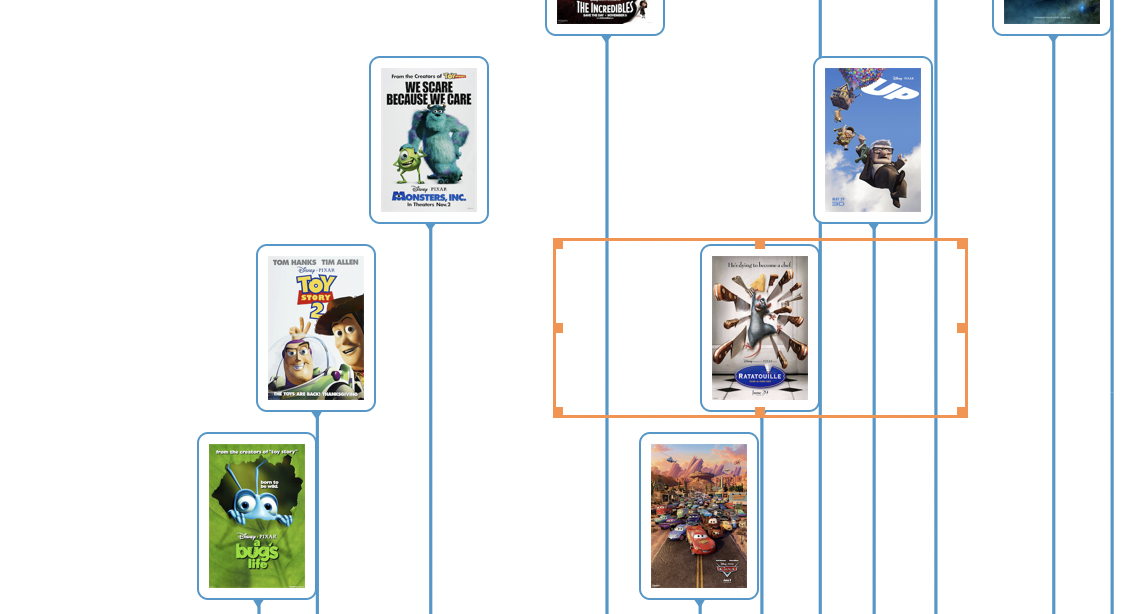
TimeLinePlot is laying out the images around the boxes. Setting the Layout Style as Packed or Overlapped makes no difference.
Here is some abridged code that I am using to generate the high resolution plot:
TimelinePlot[<|
  Import[
    [File Path], ImageSize -> {200, 300},
    ImageResolution -> 300] -> DateObject["6 14, 2024"],
  Import[
    [File Path], ImageSize -> {200, 300},
    ImageResolution -> 300] -> DateObject["6 20, 2025"],
  Import[
   [File Path], ImageSize -> {200, 300},
    ImageResolution -> 300] -> DateObject["3 6, 2026"],
  Import[
    [File Path], ImageSize -> {200, 300},
    ImageResolution -> 300] -> DateObject["6 19, 2026"]
  |>,  ImageSize -> 1200 , PlotLayout -> "Packed"]
And here is abridged code I am using the get the low resolution layout:
 TimelinePlot[<|
      Import[
        [File Path], ImageSize -> Tiny,
        ImageResolution -> 300] -> DateObject["6 14, 2024"],
      Import[
        [File Path], ImageSize -> Tiny,
        ImageResolution -> 300] -> DateObject["6 20, 2025"],
      Import[
       [File Path], ImageSize -> Tiny,
        ImageResolution -> 300] -> DateObject["3 6, 2026"],
      Import[
        [File Path], ImageSize -> Tiny,
        ImageResolution -> 300] -> DateObject["6 19, 2026"]
      |>,  ImageSize -> 1200 , PlotLayout -> "Packed"]
Does anyone have any suggestions on how to approach solving this. I have been pushing the LLM Assistant hard on the problem and Claude Code, but I am not getting anywhere.


