Group Abstract Group Abstract

Message Boards Message Boards

0
|
151 Views
|
1 Reply
|
1 Total Like
View groups...
Share
Share this post:

Internals of "Weight Loss Calculation" within Wolfram Alpha

Posted 1 day ago

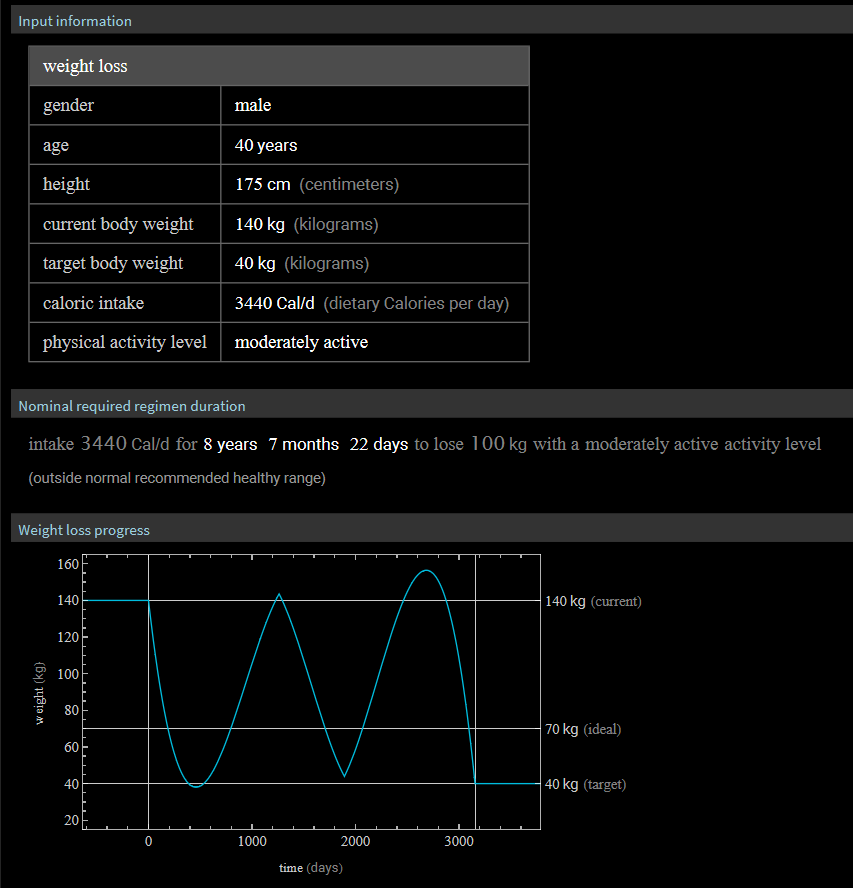
I’m curious about the calculation methods used in weight loss calculators within WA, specifically, how the weight loss progress graph is generated.

When I input unrealistic data, I observe overfitting artefacts and some jaggedness (maybe a behaviour of InterpolatingFunction). Could NDSolve / WhenEvent with be involved here?

enter image description here

I’d like to know what lies behind these calculations, but understand that BMR models are used in the formulas:

FormulaData[{"BasalMetabolicRate", "Female", "Harris-Benedict"}]

FormulaData[{"BasalMetabolicRate", "Female", "Mifflin"}]

FormulaData[{"BasalMetabolicRate", "Male", "Harris-Benedict"}]

FormulaData[{"BasalMetabolicRate", "Male", "Mifflin"}]

and Energy Expenditure involved (for example):

FormulaData[{"PhysicalActivityEnergyExpenditure", "Male"}]

but how exactly are the graph and the regimen duration calculated? I want to get code for local calculations

POSTED BY: Thea Gulina

Thanks for bringing this issue to our attention. Clearly there needs to be a check that input calorie regime isn't higher than that needed to maintain the target weight. The correct answer would be that with this regime one could never reach the target weight (or even ideal weight which requires around 2912 calories per day).

The actual code relies on RSolve:

coeff = 45359237/300000000000;(*inverse of caloric intake per unit body weight change*)
RSolve[{weight1[
    i] == -coeff*(physicalActivityLevel*
       BasalMetabolicRate[weight[i], height, age, gender] - 
      caloricIntake), 
  weight[i + 1] == weight[i] + duration/5*weight1[i], 
  weight[0] == initialweight}, {weight1[i], weight[i]}, i]
POSTED BY: Jason Martinez
Reply to this discussion
Community posts can be styled and formatted using the Markdown syntax.
Reply Preview
Attachments
Remove
or Discard