Please format your code with the code sample button on the toolbar -- it makes it easier to read and to copy and paste.
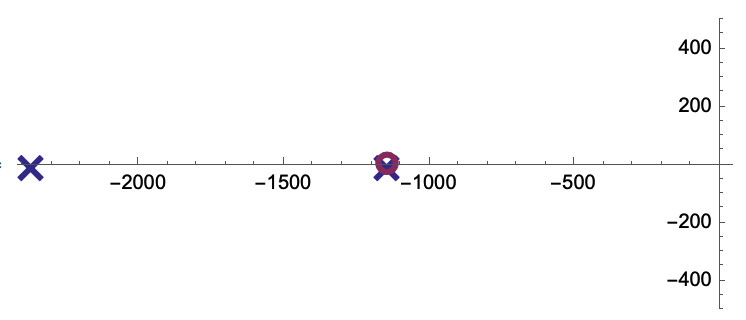
You need to use PoleZeroPlot with options -- you can't use inline notation (@). Using the code button :) it looks like this:
Control`PoleZeroPlot[tfm3,
 PoleZeroMarkers -> {Style["\[Times]", 30],
   Style["\[SmallCircle]", 40], Automatic},
 PlotRange -> {Automatic, {-500, 500}}, AxesOrigin -> {0, 0}]
You should play with the style values to get something that looks ok. This is a hard thing to plot because you have a zero and a pole in the same place so the plot does not look great.

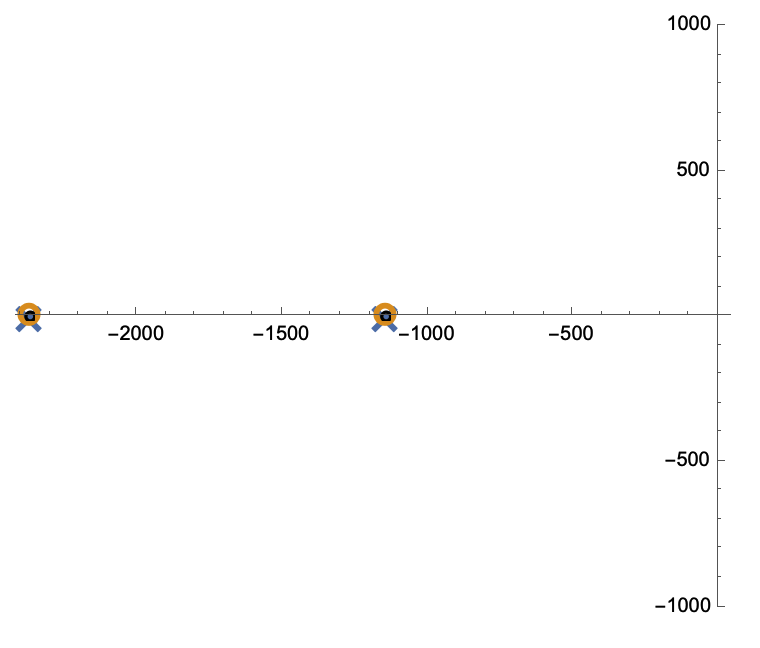
Normally, I would suggest that you do not use the unsupported/undocumented function and use RootLocusPlot instead:
RootLocusPlot[tfm3, {k, 0, 1}, FeedbackType -> None,
 PoleZeroMarkers -> {Style["\[Times]", 30],
   Style["\[SmallCircle]", 40], Automatic},
 PlotRange -> {Automatic, {-1000, 1000}}, AxesOrigin -> {0, 0}]
However, for some reason, it adds an extra zero on the plot. Maybe @Suba Thomas can explain what is happening here (Is it a bug??). if not, Suba, you should add an option to RootLocusPlot to just plot the open loop poles and an extra documentation example should be added to show how to make an open loop pole zero plot.

Lastly, another way to get publication quality plots exactly how you want them is to use TransferFunctionPoles and TransferFunctionZeros to get the poles and zeros and plot them using ListPlot and set various options to get exactly what you want (although this involves more effort in setting every option).
Regards,
Neil