Message Boards Message Boards

1
|
16614 Views
|
13 Replies
|
7 Total Likes
View groups...
Share
Share this post:

Plot pole and zero of transfer function in version 10.0

Posted 10 years ago

How to display pole and zero locations of transfer function without parameters, in version 8 there is RootLocusPlot command to Achieve this, but in version 10.0 it doesn't work without parameters and we should determine k parameter between kmin & kmax. Help me in version 10.0.

POSTED BY: Mehdi Rezai
13 Replies

Suba,

Thank you. I did not notice your use of PlotStyle->None. That does the trick!.

Yes, you can do something like the example above (which is already used in the documentation: Example 3 on the PoleZeroMarker Page) and make the Pole-Zero plot using your PlotStyle->None option:

RootLocusPlot[
 TransferFunctionModel[{{(k (10 + s^2))/(20 - 4 s + s^4)}}, s, 
  SamplingPeriod -> None, SystemsModelLabels -> None], {k, 0, 1}, 
 PlotStyle -> None, 
 PoleZeroMarkers -> {Style["\[Times]", 30], "", 
   Style["\[SmallCircle]", 40]}, PlotRange -> {{-2, 2}, {-6, 6}}]

Regards

POSTED BY: Neil Singer

Suba,

Thanks for the clarification. I think you should add an example of making an open loop pole zero plot to the RootLocusPlot documentation because there are a few subtle options that need to be set and explained:

  1. PoleZeroMarkers option takes a list of the {open-loop poles, closed-loop poles, open-loop zeros} and by putting "" for the closed loop poles, it no longer draws any closed loop poles.
  2. The value for k must be small so that the root locus that is drawn is not visible on the plot. In the example above, k=1 is small compared to the pole/zero values.

But in this documentation example, it would leave colored loci lines on the plot:

RootLocusPlot[
 TransferFunctionModel[{{(k (10 + s^2))/(20 - 4 s + s^4)}}, s, 
  SamplingPeriod -> None, SystemsModelLabels -> None], {k, 0, 1}, 
 PoleZeroMarkers -> {Style["\[Times]", 30], "", 
   Style["\[SmallCircle]", 40]}, PlotRange -> {{-2, 2}, {-6, 6}}]

enter image description here

Which can be removed with setting a tiny value for k:

RootLocusPlot[
 TransferFunctionModel[{{(k (10 + s^2))/(20 - 4 s + s^4)}}, s, 
  SamplingPeriod -> None, SystemsModelLabels -> None], {k, 0, 0.0001}, 
 PoleZeroMarkers -> {Style["\[Times]", 30], "", 
   Style["\[SmallCircle]", 40]}, PlotRange -> {{-2, 2}, {-6, 6}}]

To get:

enter image description here

Regards,

Neil

POSTED BY: Neil Singer
Posted 2 years ago

Neil,

  1. The behavior of "" is documented in a couple of places: https://reference.wolfram.com/language/ref/RootLocusPlot.html#1516150156 and https://reference.wolfram.com/language/ref/PoleZeroMarkers.html#991509519. I now think it may be a good idea to also add an example showing a pole-zero plot in the Properties and Relations section. Thanks for the suggestion.

  2. To make the loci invisible, add the option PlotStyle->None.

POSTED BY: Suba Thomas
Posted 2 years ago

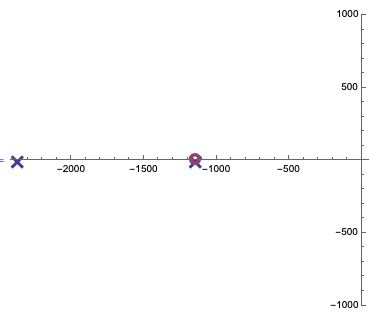
Neil: The way to get RootLocusPlot to plot a pole-zero plot is the following.

RootLocusPlot[ k tfm3[s], {k, 0, 1}, 
 PoleZeroMarkers -> {Style["\[Times]", 30], "", 
   Style["\[SmallCircle]", 40]}, PlotStyle -> None, 
 PlotRange -> {Automatic, {-1000, 1000}}, AxesOrigin -> {0, 0}]

enter image description here

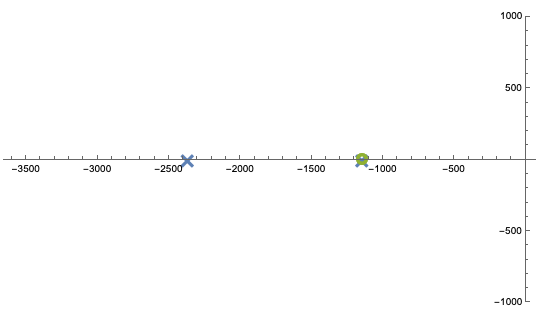
Koushik: The following should have worked, but it does not. This will directly change the size of the default markers. I will commit a fix for this.

Control`PoleZeroPlot[tfm3, 
 PoleZeroMarkers -> {{Automatic, 20}, {Automatic, 20}}, 
 PlotRange -> {Automatic, {-1000, 1000}}, AxesOrigin -> {0, 0}]

enter image description here

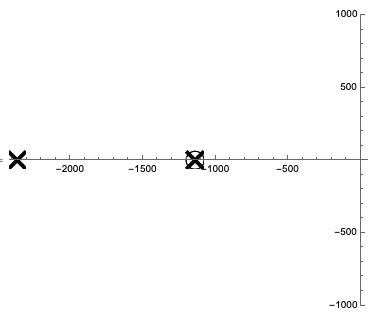
For now, the workaround is what Neil mentioned.

Control`PoleZeroPlot[tfm3, 
 PoleZeroMarkers -> {Style["\[Times]", 30], 
   Style["\[SmallCircle]", 40]}, 
 PlotRange -> {Automatic, {-1000, 1000}}, AxesOrigin -> {0, 0}]

enter image description here

POSTED BY: Suba Thomas

Dear Neil, Thank you so much for your kind help. Really appreciate this. I am learning. Regards, Koushik

POSTED BY: Neil Singer

You can use the same options as RootLocusPlot:

PoleZeroMarkers -> {Style["T", Large, Background -> Pink]}

Regards

POSTED BY: Neil Singer

Hi Suba, This command is great but how can I increase the size of the markers? Thanks. Koushik

Posted 10 years ago

You can also use Control`PoleZeroPlot.

Control`PoleZeroPlot@ButterworthFilterModel[12]

enter image description here

POSTED BY: Suba Thomas

OMG, that comand is awesone, but please, coud you explain the sintax, im new so i dont know from where this function comes or how it does to plot the things wih those markers

Posted 2 years ago

This is an undocumented function, but it's very straightforward. Given a TransferFunctionModel tfm, its pole zero plot can be obtained as

Control`PoleZeroPlot[tfm]

You are probably confused with the prefix operator @.

Control`PoleZeroPlot@tfm

also gives the same result.

POSTED BY: Suba Thomas
Posted 10 years ago

You can make the parameter a dummy -- it does not have to appear in the transfer function. The most confusing thing is that by default RootLocusPlot assumes a negative feedback loop around the transfer function. For me, by the time I want to do a root locus plot I have already developed the closed loop transfer function. So I set the FeedbackType to None.

tf = TransferFunctionModel[{{{{-40}}}, {{{-5 - 10 I, -5 + 
        10 I, -20}}}, {{1}}}, s];

RootLocusPlot[tf, {k, 0, 1}, FeedbackType -> None]
POSTED BY: David Keith
Reply to this discussion
Community posts can be styled and formatted using the Markdown syntax.
Reply Preview
Attachments
Remove
or Discard

Group Abstract Group Abstract