Message Boards Message Boards

0
|
9632 Views
|
5 Replies
|
9 Total Likes
View groups...
Share
Share this post:

Plot FFT of an interpolating function

Posted 11 years ago

Hi everyone, I have an oscillating system and i have to find the spectral components of motion of each oscillator. I found xn(t) solving system with NDSolve, I tried to calculate FFT on that result, but i cannot plot the FFT result. Could you help me please to understand what I'm doing wrong? Thank you in advance, here's the code:

    sistema = {m*x1''[t] == 0,
       m*x2''[t] == 0,
       m*x3''[t] == 0,
       m*x4''[t] + k1*(-x2[t] - x6[t] + 2 x4[t]) == 0,
       m*x6''[t] + k1*(-x5[t] - x4[t] + 2 x6[t]) == 0,
       m*x5''[t] + k1*(-x3[t] - x6[t] + 2 x5[t]) == 0,
       m*y1''[t] == 0,
       m*y2''[t] == 0,
       m*y3''[t] == 0,
       m*y4''[t] + k1*(-y2[t] - y6[t] + 2 y4[t]) == 0,
       m*y6''[t] + k1*(-y5[t] - y4[t] + 2 y6[t]) == 0,
       m*y5''[t] + k1*(-y3[t] - y6[t] + 2 y5[t]) == 0,
       m*z1''[t] == 0,
       m*z2''[t] == 0,
       m*z3''[t] == 0,
       m*z4''[t] + k1*(-z2[t] - z6[t] + 2 z4[t]) == 0,
       m*z6''[t] + k1*(-z5[t] - z4[t] + 2 z6[t]) == 0,
       m*z5''[t] + k1*(-z3[t] - z6[t] + 2 z5[t]) == 0,
       x1'[0] == 0, x2'[0] == 0, x3'[0] == 0, x4'[0] == 0, x5'[0] == 0, 
       x6'[0] == 0, y1'[0] == 0, y2'[0] == 0, y3'[0] == 0, y4'[0] == 0, 
       y5'[0] == 0, y6'[0] == 0,
       z1'[0] == 0, z2'[0] == 0, z3'[0] == 0, z4'[0] == 0, z5'[0] == 0, 
       z6'[0] == 0,
       x1[0] == 5.62726, x2[0] == 5.71947, x3[0] == 6.78594, 
       x4[0] == 6.96736, x5[0] == 8.03382, x6[0] == 8.12604,
       y1[0] == 3.23074, y2[0] == 4.52119, y3[0] == 2.41941, 
       y4[0] == 4.99979, y5[0] == 2.89802, y6[0] == 4.18846,
       z1[0] == 1.12774, z2[0] == 0.5448, z3[0] == 1.23874, 
       z4[0] == 0.07373, z5[0] == 0.76767, z6[0] == 0.18473};

soluzione = 
 NDSolve[sistema, {x1[t], x2[t], x3[t], x4[t], x5[t], x6[t], y1[t], 
   y2[t], y3[t], y4[t], y5[t], y6[t], z1[t], z2[t], z3[t], z4[t], 
   z5[t], z6[t]}, {t, 0, 1}, MaxSteps -> 1000000]
fun = x4[t] /. soluzione;
pointNo = 2560000000000;
inc = 1/pointNo;
data = Table[fun, {t, 0., 2.7*10^-10, inc}];
spettro = Fourier[data]
ListLinePlot[Abs[Fourier[data]], PlotRange -> All]

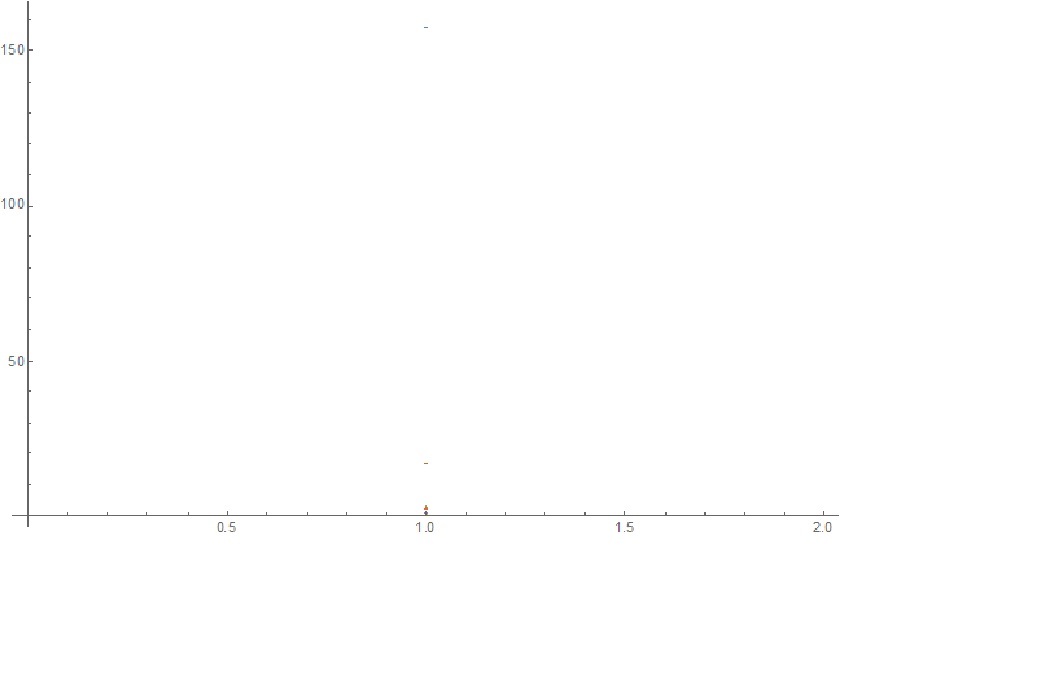
The figure I obtain is a stack of points.enter image description here
POSTED BY: Phil R
5 Replies

Forget to mention that NDSolveValue[] can be used to generate data instead of WhenEvent[]. The latter is probably more suitable for more sophisticated ''events''. The modified code is a little bit cleaner and tiny bit faster:

DATA =  NDSolveValue[
       {
         x1'[s] == y1[s],
         y1'[s] ==  - 16. x1[s],
         x2'[s] == y2[s],
         y2'[s] ==  - 25. x2[s],
         x1[0] == 0.0,
         y1[0] == 1.0,    
         x2[0] == 1.0,
         y2[0] == 0.0
       },
       {x1[#],x2[#]} & /@ Table[s,{s,1.,1000.,1.}],
       {s,0,1000},
       MaxSteps -> Infinity,
       Method -> {
         "ImplicitRungeKutta",
         "DifferenceOrder" -> 10,
         "Coefficients" -> "ImplicitRungeKuttaGaussCoefficients",
         "ImplicitSolver" -> {
          "Newton", 
          AccuracyGoal -> MachinePrecision, 
          PrecisionGoal -> MachinePrecision, 
          "IterationSafetyFactor" -> 1
         }
       }
]  // Transpose ;
ListLogPlot[Abs[Fourier/@DATA],PlotRange->All,Frame->True,ImageSize-> 500]

I.M.

POSTED BY: Ivan Morozov

Consider this new feature in Mathematica if you want to include {m, k1} as a set of variables for your ODE's.

POSTED BY: Shenghui Yang

Hi, Phil,

Fourier spectra are supposed to be different for different sample length. Read about fourier frequency resolution and Nyquist frequency to convert x axis into frequency. Also, take a look at Fourier[] documentation, FourierParameters and Applications section in particular.

I.M.

POSTED BY: Ivan Morozov
Posted 11 years ago

Hi Ivan, k1 and m are two numeric variables. I tried to modify my code as you suggested and now it seems to work. That example was very useful. Thank you so much. There's only an issue: why if I change s step, the result is totally different? For example i tried to change in your code [Mod[s,0.1] == 0. and the new plot that I obtain is that: enter image description here

which is totally different from that: enter image description here

How values on the x axis are related to the frequencies of the system?

POSTED BY: Phil R

Hi, Phil,

Not sure what is wrong with your code (you forget to include definitions for m and k1). Here is a simple example for 2 uncoupled harmonic oscillators:

DATA = Reap[
    NDSolve[
       {
         x1'[s] == y1[s],
         y1'[s] ==  - 16. x1[s],
         x2'[s] == y2[s],
         y2'[s] ==  - 25. x2[s],
         x1[0] == 0.0,
         y1[0] == 1.0,    
         x2[0] == 1.0,
         y2[0] == 0.0,    
         WhenEvent[Mod[s,1.] == 0.,Sow[{x1[s],x2[s]}]]
       },
       {},
       {s,0,1000},
       MaxSteps -> Infinity,
       Method -> {
         "ImplicitRungeKutta",
         "DifferenceOrder" -> 10,
         "Coefficients" -> "ImplicitRungeKuttaGaussCoefficients",
         "ImplicitSolver" -> {
          "Newton", 
          AccuracyGoal -> MachinePrecision, 
          PrecisionGoal -> MachinePrecision, 
          "IterationSafetyFactor" -> 1
         }
       }
    ]
][[2,1]] // Transpose ;
ListLogPlot[Abs[Fourier/@DATA],PlotRange->All,Frame->True,ImageSize-> 500]

Note, that I do not use interpolating function, but WhenEvent[] function to generate trajectory sample at s = 1,2, ...

I.M.

POSTED BY: Ivan Morozov
Reply to this discussion
Community posts can be styled and formatted using the Markdown syntax.
Reply Preview
Attachments
Remove
or Discard

Group Abstract Group Abstract