Message Boards Message Boards

GROUPS:

FFT - InverseFourier[] - ListPlot

Posted 9 years ago
8364 Views
|
3 Replies
|
0 Total Likes
|

Good Morning , I am new in this community and I hope I am writting in the rightsections. This is my question. I have created two arrays

 datF1 = Table[   1/(Sqrt[2*Pi] *t)  Exp[(-0.5*(Log[t] - 1)^2)], {t, 0.001, 30,    0.01}];     
 datF2 = Table[   1/(Sqrt[2*Pi] *t)  Exp[(-0.5*(Log[t] - 0.01)^2)] {t, 0.001, 30,   0.01}];

Where datF1 and datF2 represents the samples of a lognormal r.v from to 30 , so 3000 samples.

Then I have applied the FFT

F1 = Fourier[datF1];
F2 = Fourier[datF2];

... defined F3 = F1*F2 and applied the InverseFourier

datF3 = InverseFourier[F3];

And plotted datF3 using the ListPlot[] functions obtaining this :
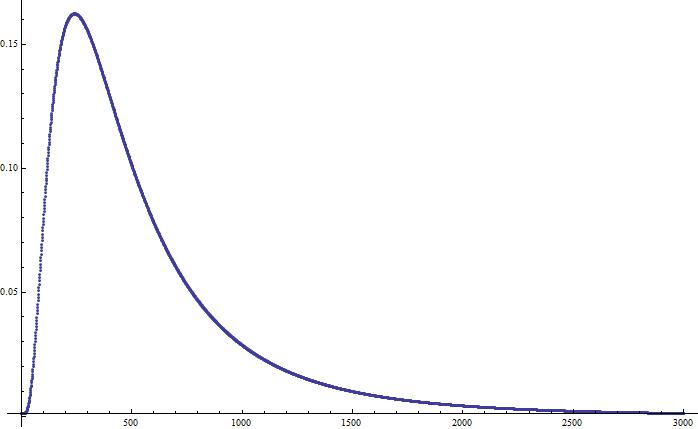
enter image description here

And this is what I wanted, but I want rescale the x-axis. I would pass from a x-axis with a scale representing the number of points od the array, to a scale in t domain. Do you know if is it possible ? Do I have to change any functions used ? Other ?

Thank you in advance,

Stefano

POSTED BY: Stefano Pavinato
3 Replies
Posted 9 years ago

Ivan Morozov is directly generating the list of times associated with the 3000x1 list, so you just need to ListPlot the 3000x2 list he calculated. The x axis values are now the times, and the x-axis scale will be in time, not index. Since you've done a Fourier and and InverseFourier, these are the original times, so you could also use this:

times = Table[t, {t, 0.001, 30, 0.01}];

ListPlot[{times, datF3} // Transpose]

You could also use

ListPlot[datF3, DataRange -> {0.001, 30}]
POSTED BY: David Keith
Posted 9 years ago

... And this is what I wanted, but I want rescale the x-axis.

Would this general idea help?

r=Range[0,5]

{0,1,2,3,4,5}

30*Rescale[r]

{0,6,12,18,24,30}

POSTED BY: Dana DeLouis

Hi,

Probably, what you need can be done with ListPlot[] options, but brute force solution may look like this:

ListPlot[Transpose[Join[{Range[30./3000.,30.,30./3000.]},{datF3}]]]

or

 ListPlot[MapThread[List,{Range[30./3000.,30.,30./3000.],datF3}]]

I.M.

POSTED BY: Ivan Morozov
Reply to this discussion
Community posts can be styled and formatted using the Markdown syntax.
Reply Preview
Attachments
Remove
or Discard

Group Abstract Group Abstract