list1 is X values list2 is Y values
The x and y values in each are in order with each other.
Can I get ListPlot to assemble these two lists as x,y points in a scatter plot?
I don't see the option.
Thank you George - I should have looked more carefully at commands for list manipulation rather than options under ListPlot. That saves me a few lines of code for constructing a dummy list for plotting.
Maybe Wolfram documentation should actually show Transpose under ListPlot. I did look!
Doug
Use Transpose.
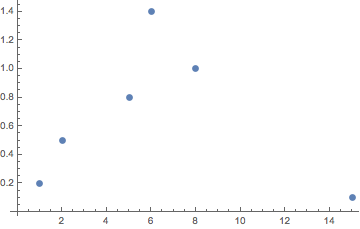
list1 = {1, 2, 5, 6, 8, 15};
list2 = {.2, .5, .8, 1.4, 1.0, .1};
ListPlot[Transpose[{list1, list2}]]
This should do what you want.