Message Boards Message Boards

0
|
9901 Views
|
3 Replies
|
3 Total Likes
View groups...
Share
Share this post:

How do I make a histogram using data from a frequency distribution table?

Posted 10 years ago

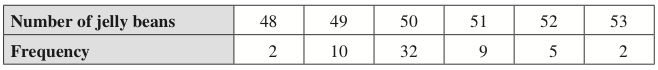
In my maths textbook I already have the frequency distribution table, and I want to create a histogram using that data. And when I'm inputting the data into my histogram, rather than listing each number the amount of times it occurs (e.g.{48,48,49,49,49,49,49,49,49,49,49,49,...,53,53}), is it possible to input something that the histogram would recognise as the frequency of a number (e.g. "50 occurs 32 times", rather than typing 50, 32 times).

The frequency distribution table I have to work with

3 Replies

Well one hack would be to generate the needed data for the histogram from your specification. So, let's say your spec what you suggested, e.g. {value,nValues}. Then you could recreate the data from this by using ConstantArray on it. Here's an example:

dataSpec = {{1, 12}, {3, 4}, {9, 34}, {32, 7}};

histogramData = ConstantArray[#[[1]], #[[2]]] & /@ dataSpec

Histogram[histogramData, 40]
POSTED BY: David Reiss

How would I then work out the average using the number set I have just gotten, without having to go in and manually delete all the " { } "

The average is just taking each data item times its frequency and adding them all together and then dividing by the total of all the frequencies. So....

In[2]:= dataSpec = {{1, 12}, {3, 4}, {9, 34}, {32, 7}};

In[3]:= data = dataSpec[[All, 1]]

Out[3]= {1, 3, 9, 32}

In[4]:= frequencies = dataSpec[[All, 2]]

Out[4]= {12, 4, 34, 7}

In[6]:= Tr[data frequencies]/Tr[frequencies]

Out[6]= 554/57
POSTED BY: David Reiss
Reply to this discussion
Community posts can be styled and formatted using the Markdown syntax.
Reply Preview
Attachments
Remove
or Discard

Group Abstract Group Abstract