Message Boards Message Boards

0
|
11573 Views
|
5 Replies
|
3 Total Likes
View groups...
Share
Share this post:

How do you get the same graph? i've tried without success

Posted 10 years ago

Hello everyone doing research in many places, I found the following matlab code and try to make a translation to mathematica, I share the notebook but the problem arises when comparing the graphs obtained in both programs since they are very different, I wonder if there is anyone in this community who can help me to find the solution to my problem. Thanks in advance and happy new year !

Attachments:
POSTED BY: Luis Ledesma
5 Replies
Posted 10 years ago

Jaebum Jung many thanks for helping me to solve my problem, also thank you to devote your time to find the bug in my code, thanks to your help I could see a beautiful graph.

POSTED BY: Luis Ledesma
Posted 10 years ago

Briefly looked at your code.
At the bottom part of your code:

fielduno = # - fielduno[[1, 1]] & /@ fielduno;

{out, c2, c0} = rhod[{0, 0}, {0, 0}, R, 2*H];

fielduno = 
  fielduno + 
   KroneckerProduct[ty*RandomVariate[NormalDistribution[], n], 
     tx*RandomVariate[NormalDistribution[], m]]*Sqrt[2*c2];

after that the following will be enough:

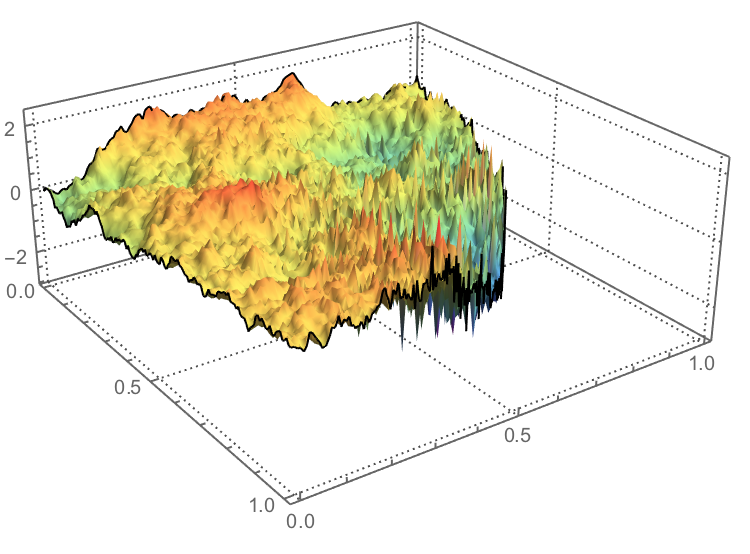
data = Table[fielduno[[i, j]], {i, n/2}, {j, m/2}];

ListPlot3D[data, Mesh -> None, PlotTheme -> "Detailed", 
 ColorFunction -> ColorData["Rainbow"], DataRange -> {{0, 1}, {0, 1}},
  RegionFunction -> Function[{x, y, z}, Norm[{x, y}] < 1]]

enter image description here

POSTED BY: Jaebum Jung
Posted 10 years ago

Hello again I've been working to get this graphic, from my previous comment, but I can still not get it, the maximum that I could do is the following graphic

attemp

that com will see does not seem anything, I will continue to work but i would like some help in the community if possible. Thanks in advance

POSTED BY: Luis Ledesma
Posted 10 years ago

Hello Sam after searching for help to get the graphic as your ask here it, I must remind you that I not is much of matlab, did my notebook of mathematica with the help of some friends at the University but they could not help me to find my failure in the graph

graphics desire

I hope someone can help me

POSTED BY: Luis Ledesma

People who do not have Matlab would benefit at least from the picture of original graph you would like to reproduce. Can you add it to your post?

POSTED BY: Sam Carrettie
Reply to this discussion
Community posts can be styled and formatted using the Markdown syntax.
Reply Preview
Attachments
Remove
or Discard

Group Abstract Group Abstract