Version: Mathematica 10.0.2.0, Platform: Mac OS X 10.9.5 x86
I see Mathematica 10.0.2 uses GeometricTransformation to render PlotMarkers. This is an improvement, as the impreciseness of the old PlotMarkers has been a major pain for high quality data visualization. But there seems to be a bug when working together with Epilog and Insets. Consider the following code:
ListPlot[Table[n^(1/p), {p, 4}, {n, 10}], PlotMarkers -> Automatic,
 Epilog -> {
   Inset[Graphics[{Red, Text[Style["text one", 16]]}], {1.5, 5.5}],
   Inset[Graphics[{Green, Text[Style["text two", 16]]}], {8, 5.5}]
   },
 PlotLabel -> $Version,
 ImageSize -> Medium
 ]
Screenshots:
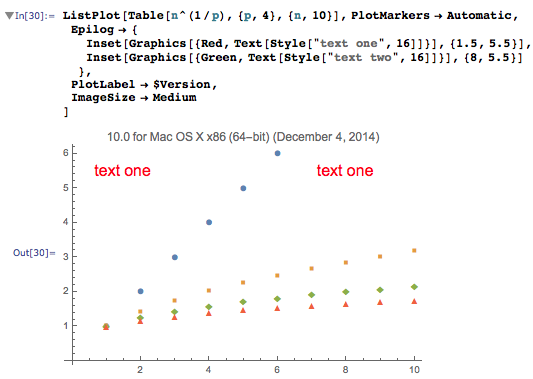
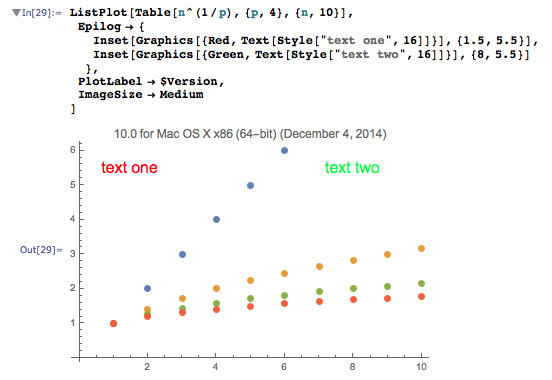
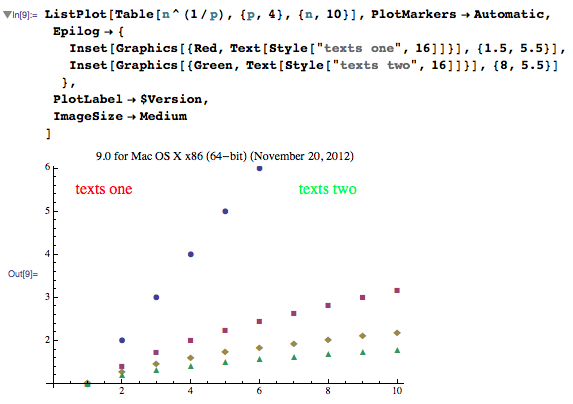
Here I insert two texts in the figure using Epilog and Inset. Instead of getting a red "text one" and a green "text two", I get two red "text one" (Fig. [1]). The correct result is produced if I remove PlotMarkers -> Automatic (Fig. [2]), or evaluate it in Mathematica 9.0.0.0 (Fig. [3]).
The problem is clear in the full form. Without the presence of PlotMarkers, Mathematica 10.0.2.0 parses Epilog as usual:
Rule[Epilog,
 List[Inset[
   Graphics[List[RGBColor[1, 0, 0], Text[Style["texts one", 16]]]],
   List[1.5`, 5.5`]],
  Inset[Graphics[
    List[RGBColor[0, 1, 0], Text[Style["texts two", 16]]]],
   List[8, 5.5`]]]]
With the presence of PlotMarkers, Mathematica 10.0.2.0 uses GeometricTransformation to render the insets along with the plot markers. However, it seems Mathematica 10.0.2.0 failed to parse two insets given by Epilog correctly.
Rule[Epilog,
 List[GeometricTransformation[
   Inset[Graphics[
     List[RGBColor[1, 0, 0], Text[Style["text one", 16]]]],
    List[0.`, 0.`]],
   List[List[List[1.5`, 5.5`]], List[List[8, 5.5`]]]]]]
I think this is a bug.


