Message Boards Message Boards

How can I make an automatic legend in this graph?

Hello everyone,

i am trying to make an analysis of the levels of cortisol depending of the time when the samples were taken. So i tried this code:

MapThread[
 SmoothHistogram[
   Table[Pick[#1, time, sp], {sp, DeleteDuplicates[time]}], 
   Frame -> True, FrameLabel -> {"Cort (mmol/DL)", "Poblation"}, 
   BaseStyle -> {"Arial"}, PlotStyle -> Thick, PlotLabel -> #2, 
   Ticks -> All] &, {{cortA, cortB, cortC, cortD}, {"A", "B", "C", 
   "D"}}]

and this shows me what I need, except for the legends, I mean, I can see the graphs with the curves, but I don't know which curve belongs to the corresponding time:

enter image description here

So, i would like to know if there some way to add the corresponding legend automatically?

Thank you very much.

I going to include the spreadsheet and he Mathematica notebook

Attachments:
POSTED BY: Oscar Rodriguez
5 Replies
Posted 10 years ago

Hi Oscar,

Your notebook does not execute for me, even when it properly loads the data. I think it is because the pattern sp is not defined. If you can correct that I can look further.

However, it appears the function you defined and are threading over creates a histogram for each time, where the time values are made unique. These same time values extracted withing the function can be used as the value for PlotLegends. The times appear to be same for all executions of the it would help in diagnosing to pull out unique computations so they do not add to the confusion of threading the pure function.

Best, David

Edit: I suspect something like this would work. Note that PlotLegends uses the same list of time values as is used to build the list of data lists being given to SmoothHistogram.

MapThread[SmoothHistogram[
   Table[Pick[#1, time, sp], {sp, DeleteDuplicates[time]}],
   PlotLegends -> DeleteDuplicates[time],
   Frame -> True, FrameLabel -> {"Cort (mmol/DL)", "Poblation"}, 
   BaseStyle -> {"Arial"}, PlotStyle -> Thick, PlotLabel -> #2, 
   Ticks -> All] &, {{cortA, cortB, cortC, cortD}, {"A", "B", "C", 
   "D"}}]
POSTED BY: David Keith
Posted 10 years ago

Hi Oscar,

Plot legends can be added as an option to SmoothHistogram. Here is an example:

d1 = RandomVariate[NormalDistribution[5, 2], 1000];

d2 = RandomVariate[NormalDistribution[8, 3], 1000];

SmoothHistogram[{d1, d2}, PlotLegends -> Placed[{"d1", "d2"}, Bottom]]

enter image description here

POSTED BY: David Keith

Thanks David,

But my problem is that when i apply this code: MapThread[ SmoothHistogram[ Table[Pick[#1, time, sp], {sp, DeleteDuplicates[time]}], Frame -> True, FrameLabel -> {"Cort (mmol/DL)", "Poblation"}, BaseStyle -> {"Arial"}, PlotStyle -> Thick, PlotLabel -> #2, Ticks -> All] &, {{cortA, cortB, cortC, cortD}, {"A", "B", "C", "D"}}]

it automatically extract the information and make the plots, but it do not make the legends, and as you can see, are several curves in each plot, so it is difficult to know what information is being represented. So, i would like to know if there is another line of code to extract and plot the legend automatically too?

I really appreciate any help

POSTED BY: Oscar Rodriguez
Posted 10 years ago

Hello again, Oscar,

I was mistaken when I said the error was due to sp being undefined -- I didn't look closely enough. The error I get is due to the fact that for one of the times there is only one data entry, so SmoothHistogram finds that one of its data sets contains only one element. enter image description here

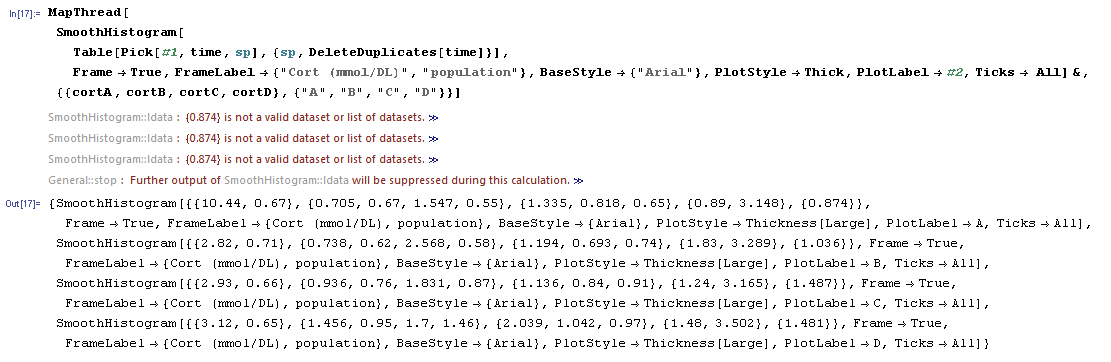
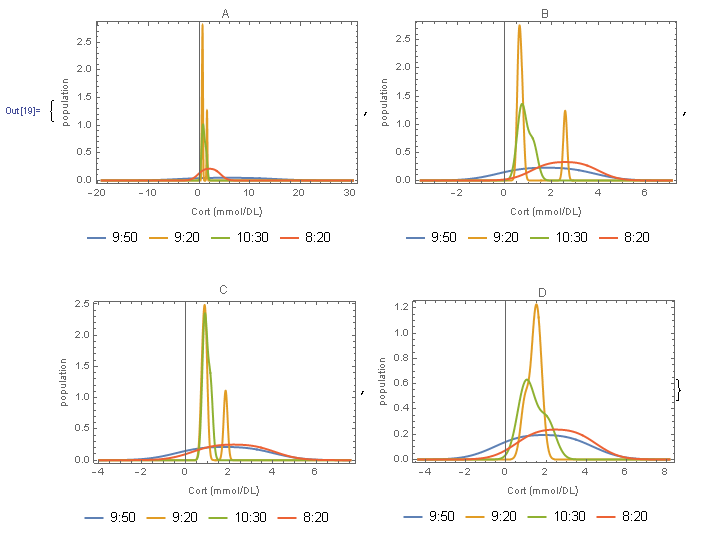
This may be because the data spreadsheet you posted is a subset. But in any case in the code below I correct this by defining a set of valid times which includes only those with more than one entry. I then add a PlotLegends to your function, and also set the image size to a value that produces nice looking results. (And I set PlotRange->All to avoid cutting off sharp peaks.)

Here is the modified code and result. I also attach a notebook.

Kind regards,

David

In[18]:= validTimes = First /@ Select[Gather[time], Length[#] > 1 &]

Out[18]= {"9:50", "9:20", "10:30", "8:20"}

In[19]:= plots = MapThread[
  SmoothHistogram[
    Table[Pick[#1, time, sp], {sp, validTimes}],
    PlotLegends -> Placed[validTimes, Bottom], ImageSize -> 300,
    PlotRange -> All,
    Frame -> True, FrameLabel -> {"Cort (mmol/DL)", "population"}, 
    BaseStyle -> {"Arial"}, PlotStyle -> Thick, PlotLabel -> #2, 
    Ticks -> All] &,
  {{cortA, cortB, cortC, cortD}, {"A", "B", "C", "D"}}]

enter image description here

Attachments:
POSTED BY: David Keith

Hi David,

You are right, it is a subset. I tried what you teach me, it works perfectly. I really appreciate your help.

Kind regards,

Óscar

POSTED BY: Oscar Rodriguez
Reply to this discussion
Community posts can be styled and formatted using the Markdown syntax.
Reply Preview
Attachments
Remove
or Discard

Group Abstract Group Abstract