Hello again, Oscar,
I was mistaken when I said the error was due to sp being undefined -- I didn't look closely enough. The error I get is due to the fact that for one of the times there is only one data entry, so SmoothHistogram finds that one of its data sets contains only one element.

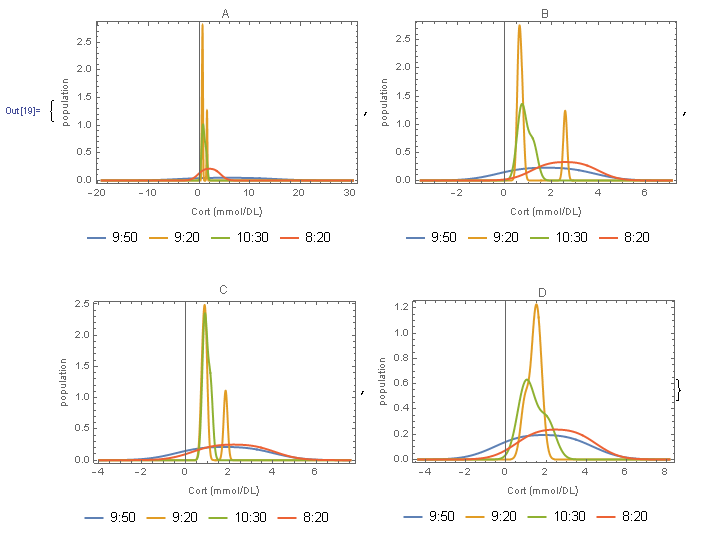
This may be because the data spreadsheet you posted is a subset. But in any case in the code below I correct this by defining a set of valid times which includes only those with more than one entry. I then add a PlotLegends to your function, and also set the image size to a value that produces nice looking results. (And I set PlotRange->All to avoid cutting off sharp peaks.)
Here is the modified code and result. I also attach a notebook.
Kind regards,
David
In[18]:= validTimes = First /@ Select[Gather[time], Length[#] > 1 &]

Out[18]= {"9:50", "9:20", "10:30", "8:20"}

In[19]:= plots = MapThread[
  SmoothHistogram[
    Table[Pick[#1, time, sp], {sp, validTimes}],
    PlotLegends -> Placed[validTimes, Bottom], ImageSize -> 300,
    PlotRange -> All,
    Frame -> True, FrameLabel -> {"Cort (mmol/DL)", "population"},
    BaseStyle -> {"Arial"}, PlotStyle -> Thick, PlotLabel -> #2,
    Ticks -> All] &,
  {{cortA, cortB, cortC, cortD}, {"A", "B", "C", "D"}}]

 Attachments: