I am trying to plot a very large list of data but in such a manner that beyond certain limit it should hit the roof and give same color even if the number is much higher then the limit. How can I do it? My list has a structure {{x,y,f}, ... } . Thanks.
Thanks!
The simplest way is to plot the rest and use ClippingStyle - > color for your roof.
ClippingStyle - > color
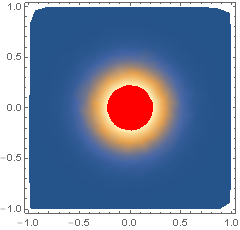
data = Table[{x = RandomReal[{-1, 1}], y = RandomReal[{-1, 1}],   Exp[10 (-x^2 - y^2)]}, {1000}];

ListDensityPlot[data, PlotRange -> {0, .6}, ClippingStyle -> Red]