Hi!
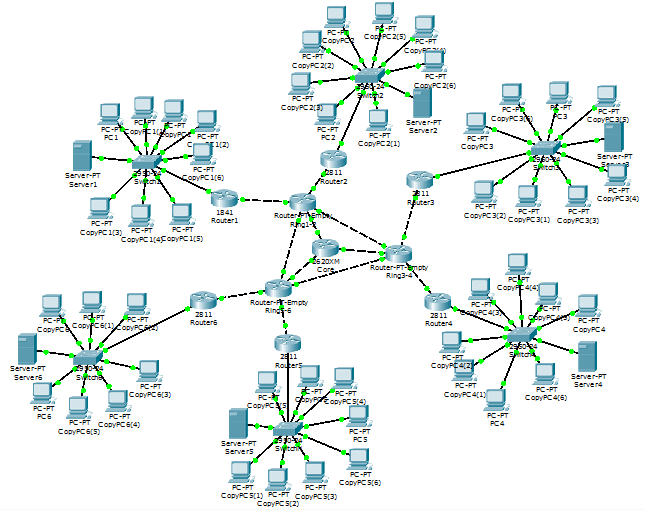
I'm trying to create network map, using Mathematica. As input I have information about all links on the network, including port numbers, speed, etc. The main task is just visualization of this data.
Network equipment divided by network's layers: core, aggregation and distribution (or similar). Nodes on each part of network are known and must be respectively displayed (with different color, image, as example).
Now I'm trying to display link table with ports and speed, but can't correctly display labels on edges: can't correctly place port's numbers at start end of edge - they intersect with node image.
As result would like to get something like this, but with signed ports on links: 
Can anybody help me with this? I'm totally newbie in Wolfram Math :( Input data can be preformed as you wish.