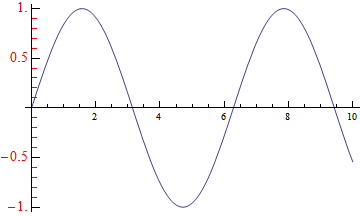
The Presentations application, which I sell through my website and among many other features has custom tick routines. These allow you to scale the tick labels using any monotonic function, adjust both the large and small tick sizes, specify the style of the ticks and independently the style of the labels. In the following I enlarge the x ticks in your plot by a factor of 1.5 and the y ticks by a factor of 2. Just for fun, I increased the font size of the y labels and changed their color to red, and also changed the color of the minor ticks to red. Another feature of Presentations, OptionFinder, made it very easy to find and paste in the options for CustomTicks (and any other routine) since they might not be totally obvious to a user.
<< Presentations`
xticks = CustomTicks[Identity, {0, 10, 2, 4},
   CTTickSpecs -> 1.5 {0.0125`, 0},
   CTUnLabTickSpecs -> 1.5 {0.0075`, 0}];
yticks = CustomTicks[Identity, {-1, 1, 0.5, 5},
   CTTickSpecs -> 2 {0.0125`, 0},
   CTUnLabTickSpecs -> 2 {0.0075`, 0},
   CTUnLabTickStyle -> {Red, AbsoluteThickness[0.125`]},
   CTNumberFunction -> (Style[#, 14, Red] &)];
Plot[Sin[x], {x, 0, 10},
 Ticks -> {xticks, yticks}]

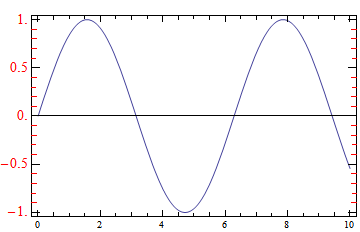
Here is a Frame plot with the same tick specifications:
Plot[Sin[x], {x, 0, 10},
 Frame -> True,
 FrameTicks -> {{yticks, yticks // NoTickLabels}, {xticks,
    xticks // NoTickLabels}}]
