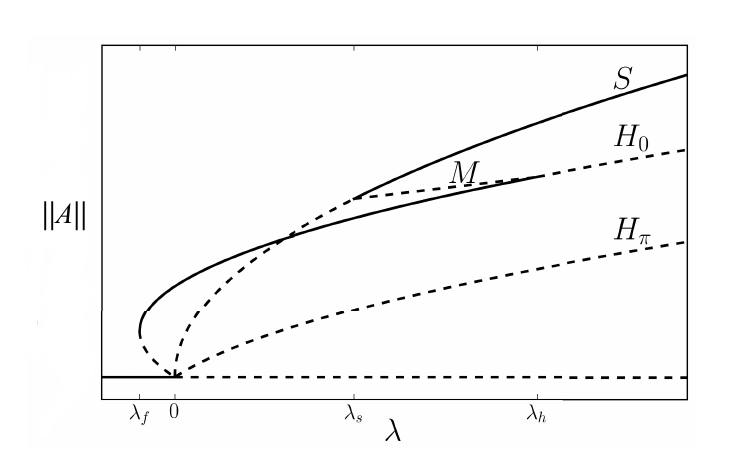
Hello, I am new to Wolfram Mathematica, and I try to work with it to plot bifurcation diagram. The quest is to plot lines that are continous in one range and dashed in another range. The key point is that there is a function that gives me the information whether the line is continous (stable) or dashed (unstable). Is there a way to switch between a continuous line-style to a dashed line-style depending on a value of another function?
