Message Boards Message Boards

0
|
26883 Views
|
1 Reply
|
1 Total Likes
View groups...
Share
Share this post:

Plotting bifurcation diagrams using Mathematica

Posted 10 years ago

Hello, I am new to Wolfram Mathematica, and I try to work with it to plot bifurcation diagram. The quest is to plot lines that are continous in one range and dashed in another range. The key point is that there is a function that gives me the information whether the line is continous (stable) or dashed (unstable). Is there a way to switch between a continuous line-style to a dashed line-style depending on a value of another function?
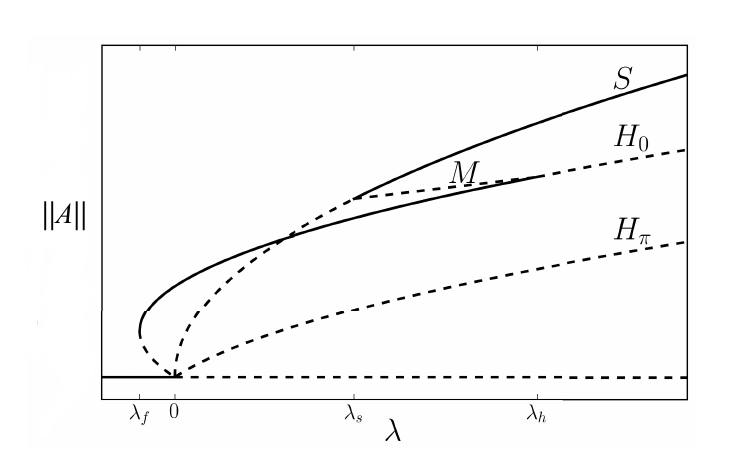
bifurcation diagram

POSTED BY: Omer Tzuk

Bifrucation diagrams are a bit more tricky than plotting a function. There are a couple of resources online about how to write this function. I would reccomend taking a look at this one:

http://mathematica.stackexchange.com/questions/13277/mathematica-code-for-bifurcation-diagram

POSTED BY: Sean Clarke
Reply to this discussion
Community posts can be styled and formatted using the Markdown syntax.
Reply Preview
Attachments
Remove
or Discard

Group Abstract Group Abstract