Message Boards Message Boards

0
|
9920 Views
|
18 Replies
|
4 Total Likes
View groups...
Share
Share this post:

maximumlikelihood estimates and its variance

Posted 10 years ago

Hi everyone I am interested in the simulation of maximumlikelihood estimates and its variance can any one help me.

POSTED BY: Maha haroon
18 Replies
Posted 10 years ago

plz someone help me in this regard I have uploaded the file ,I have tried my level best but unable to find error.

POSTED BY: Maha haroon
Posted 10 years ago

The likelihood of any value of mu greater than Min[x] is zero (which means that the log likelihood is minus infinity) so there no need to show anything larger than Min[x] so that is used for the upper bound. That just one standard deviation below the maximum likelihood estimate is used is because that tends (for this likelihood) to place the maximum likelihood estimate in the center of the contour plot. It is somewhat arbitrary, yes.

POSTED BY: Jim Baldwin
Posted 10 years ago

For iteration, see no of error occur .

Attachments:
POSTED BY: Maha haroon
Posted 10 years ago

For Contour plot , whynot you consider the range of mu, mu-3sigma to mu + 3 sigma, why you do this only for lambda.

POSTED BY: Maha haroon
Posted 10 years ago

Okay .. but what about simulation if I want to simmulate the above code ??

POSTED BY: Maha haroon
Posted 10 years ago

At this point my recommendation is to spend more time learning the basics of Mathematica. If you come to a point where you're stuck, send in a concise example that illustrates the problem you're having: new problem, new post.

POSTED BY: Jim Baldwin
Posted 10 years ago

jim Thanx a lot, its really a great help from your side. Once again a big thanx. As for as your question is concerned , Yes I m interested in mixture distribution. But firstly I do it for simple case , Now sir my question regarding to above programme are (1): its only for one data set .I need for repeated times like 1000 , or 10,000 times that we get 10000 mle and variance covariance matrices and on the average we report the results. (2): Second is will you plz explain the contour plot I mean its command and its interpretation . Third and last question is there is iterative method like newton raphson method how that can be used for mle and variance covariance .

POSTED BY: Maha haroon
Posted 10 years ago

Just for completeness: based on the likelihood and method of random selection, you are estimating the parameters from random samples from a translated Weibull with translation parameter \mu, shape parameter k=2, and scale parameter \lambda^(-1/2). So I'm not seeing why you would say "I have a mixture distribution."

I've also attached the notebook (which I wasn't able to do yesterday).

Attachments:
POSTED BY: Jim Baldwin
Posted 10 years ago

I made a few corrections. (One correction is the need to have separate variables for the parameters to generate the data and the parameters to be estimated.) For this log likelihood, Maximize works better than NSolve (in part I think because maximum likelihood estimator of mu is so close to the minimum data value). I also added some QA checks to see if the solution makes sense (which for just about any iterative method is highly recommended).

The estimate of the covariance matrix is also included but I wonder if because you are doing simulations and looking to characterize the sampling distributions of the maximum likelihood estimates, do you really need that? The "true" covariance matrix would be estimated from the results of the multiple simulations performed (unless you're also interested in the sampling properties of the estimated covariance matrix).

Below is the code:

(*Maximum likelihood example*)

(*Set parameter values*)
n = 50; \[Mu]0 = 5; \[Lambda]0 = 3;

(* Generate data *)
u = RandomReal[UniformDistribution[{0, 1}], n];
x = \[Mu]0 + Sqrt[Log[1 - u]/-\[Lambda]0];

(* Log likelihood *)
logL = n*Log[2] + n*Log[\[Lambda]] + \!\(
\*UnderoverscriptBox[\(\[Sum]\), \(i = 1\), \(n\)]\(Log[
     x[\([i]\)] - \[Mu]]\)\) - \[Lambda]*\!\(
\*UnderoverscriptBox[\(\[Sum]\), \(i = 1\), \(n\)]
\*SuperscriptBox[\((x[\([i]\)] - \[Mu])\), \(2\)]\);

(* Find maximum likelihood estimates *)
sol = Maximize[{logL, \[Mu] < Min[x] && \[Lambda] > 
     0}, {\[Mu], \[Lambda]}]
mle = {\[Mu], \[Lambda]} /. sol[[2]];

(* First order partials *)
DlogL = D[logL, {{\[Mu], \[Lambda]}}];

(* Calculate variance estimates using second order partials *)
hessian = D[DlogL, {{\[Mu], \[Lambda]}}] /. sol[[2]];
v = -Inverse[hessian];
MatrixForm[v]

(* Check to see that the first order partials are close to zero with \
estimates of \[Mu] and \[Lambda] *)
DlogL /. sol[[2]]

(* Additional check:  show contour plot of log likelihood around the \
mle's *)
c = ContourPlot[logL, {\[Mu], mle[[1]] - v[[1, 1]]^0.5, Min[x]},
   {\[Lambda], mle[[2]] - 3 v[[2, 2]]^0.5, mle[[2]] + 3 v[[2, 2]]}, 
   Contours -> 100];
m = ListPlot[{mle}];
Show[{c, m}]

with the following output:
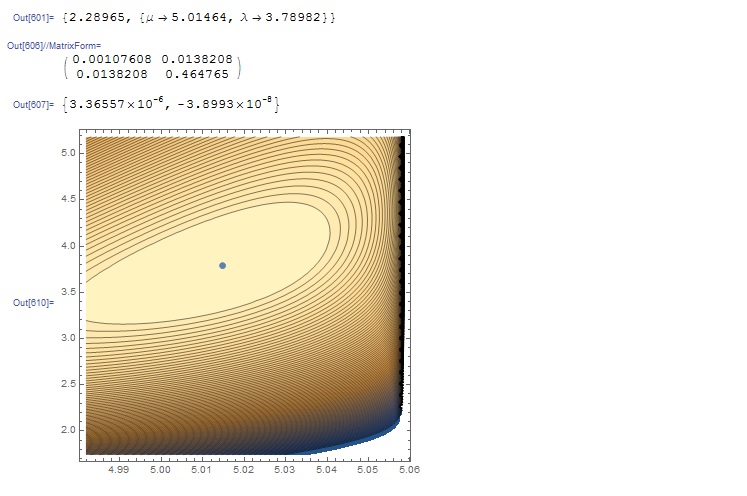
mle output

POSTED BY: Jim Baldwin
Posted 10 years ago

See I didnt get the right result , I couldnt find the error in this

Attachments:
POSTED BY: Maha haroon
Posted 10 years ago

This community will work fine for any discussions (although the discussion has been a bit one-sided so far - but that can change).

POSTED BY: Jim Baldwin
Posted 10 years ago

Jim can you plz give me your mailing Id ?? I need to discuss plz do me a favour.

POSTED BY: Maha haroon
Posted 10 years ago

Here is a short example:

(* Maximum likelihood example *)

(* Set data values *)
n = 50; v = 5; n0 = 13; m = 144;

(* Log likelihood *)
logL = (n0 Log[1 - psi + psi (1 - p)^v] + (n - n0) Log[psi] + 
   m Log[p] + (v (n - n0) - m) Log[1 - p])

(* First order partials *)
DlogL = D[logL, {{psi, p}}]

(* Find values of psi and p that result in the partial derivatives \
being zero *)
(* But note that in this case there are values of n0 and m that \
result in maximum likelihood estimates not having the partials equal \
to zero so NMaximize directly on the log likelihood is more \
appropriate in such cases *)
solution1 = 
 NSolve[DlogL == {0, 0} && 0 < psi <= 1 && 0 < p <= 1, {psi, p}]
solution2 = NMaximize[{logL, 0 < psi <= 1 && 0 < p <= 1}, {psi, p}]

(* Now to estimate the variances (and this only works if the mle \
estimates of psi and p are both not zero or one) *)
D2logL = Flatten[D[DlogL, {{psi, p}}] /. solution1, 1]
v = -Inverse[D2logL];
MatrixForm[v]
POSTED BY: Jim Baldwin
Posted 10 years ago

I know and we sure do. Looking forward to see where you are on this.

POSTED BY: Jim Baldwin
Posted 10 years ago

You know for likelihood estimates we differentiate log- likelihood function with respect to paramerters , as a result we get some implicite or explicit form of equations with respect to parameters , I need their variance covariance matrix also

POSTED BY: Maha haroon
Posted 10 years ago

You've probably seen responses like this before in this forum: "It's pretty hard to give specific advice to very general questions and your chances of getting the response you need will be greatly enhanced by you presenting specifics." It would seem what would be needed is either the likelihood (or log-likelihood) equation written in Wolfram Language along with a section to generate data of interest (as you'd certainly need that to perform the simulations you mentioned).

In short, what have you done?

POSTED BY: Jim Baldwin
Posted 10 years ago

I have seen this book ,,But my problem related discussion is not in this book. I have a mixture distribution and generated radom data by using transformed method, Is there any code which is related to iterative method of solving equation. If anyone gonna help me I will be obliged.

POSTED BY: Maha haroon
Posted 10 years ago

I (always) highly recommend the book by Rose and Smith: Mathematical Statistics with Mathematica. There's a great chapter on symbolic maximum likelihood estimation. (Although maybe your mention of "simulations" might mean you would be more interested in numerical rather than symbolic solutions.)

POSTED BY: Jim Baldwin
Reply to this discussion
Community posts can be styled and formatted using the Markdown syntax.
Reply Preview
Attachments
Remove
or Discard

Group Abstract Group Abstract