Message Boards Message Boards

Moving Average of NDSolve result

Posted 10 years ago

Hello

In the flowing code, I plot the function X by using the result of the NDSolve. The result I get have frequency noise " see the figure " what I went to do is taking the time-averaged for X , it should be nearly zero but how I can do that in Mathematica ?

Clear[t]
z = 0;
r = 0.7071;
s = 4.2758;
y = 2.2758;

system = {u'[t] ==  2.2758*v[t],
   v'[t] == -  2.2758*u[t] - 2*s*E^(-(r^2) - ((t^2*(1.177^2))/(13.8)^2))*Cos[k*z - y*t]*w[t],
   w'[t] == 2*s*E^(-(r^2) - (t^2*(1.177^2))/(13.8)^2)*Cos[k*z - y*t]*v[t]};
initialvalues = {u[-20] ==  0, v[-20] ==  0, w[-20] ==  -1};
sol = NDSolve[Join[system, initialvalues], {u[t], v[t], w[t]}, {t, -20, 20}];

X = (- 2*s*u[t]*r)*E^(-(r^2) - (t^2*(1.177^2))/(13.8)^2)*Cos[k*z - y*t];


P1 = Plot[Evaluate[X /. sol], {t, -20, 20}, Frame -> True, FrameLabel -> {"t", "X"}, FrameTicks -> All]

The result

POSTED BY: saysics saja
4 Replies

added time average (which is the integral over the range divided by the range).

Here it is again:

enter image description here

Manipulate[Module[{data, i, x, area, average},
  x = (-2*s*u[t]*r)*E^(-(r^2) - (t^2*(1.177^2))/(13.8)^2)*Cos[k*z - y*t];
  data = Table[{i, x /. sol /. t -> i}, {i, -20, 20, .1}];
  area = Integrate[u[t] /. sol, {t, -20, 20}];
  average = area/(40); (*area = width*hight*)
  data[[2]] = ListConvolve[Table[1/windowSize, {windowSize}], data[[All, 2]]];

  Show[
   ListLinePlot[data[[2]], DataRange -> {-20, 20}, Frame -> True,
    FrameLabel -> {{"u(t)", None}, {"time (sec)",
       Row[{"smoothed using windows size ", windowSize, " time average =", average}]}},
    ImagePadding -> 30],
   Plot[average, {x, -20, 20}, PlotStyle -> Red]
   ]
  ],
 {{windowSize, 6, "window size?"}, 3, 20, 1},
 ControlPlacement -> Top, Alignment -> Center,
 ImageMargins -> 0, FrameMargins -> 0,     
 Initialization :> (
   z = 0;
   r = 0.7071;
   s = 4.2758;
   y = 2.2758;
   system = {u'[t] == 2.2758*v[t], v'[t] == -2.2758*u[t] - 2*s*E^(-(r^2) - ((t^2*(1.177^2))/(13.8)^2))*Cos[k*z - y*t]*w[t], 
     w'[t] == 2*s*E^(-(r^2) - (t^2*(1.177^2))/(13.8)^2)*Cos[k*z - y*t]*v[t]};       
   initialvalues = {u[-20] == 0, v[-20] == 0, w[-20] == -1};       
   sol = First@NDSolve[Join[system, initialvalues], {u[t], v[t], w[t]}, {t, -20, 20}]
   )
 ]
POSTED BY: Nasser M. Abbasi
Posted 10 years ago

thank you so much but this is only smoothed the curve, and didn't give me the time-averaged for X

POSTED BY: saysics saja

Taking time average over a limited range always means a smoothing, Nassers approach is perfectly appropriate. If you want the overall time average, then:

NIntegrate[X /. First[sol], {t, -20, 20}]/40.
(*  Out:  -0.04351207150254093`  *)

Cheers Henrik

@Nasser: I am afraid the red line you are showing in your (nice!) graphic is the average over u[t] ...

POSTED BY: Henrik Schachner
Posted 10 years ago

Thanks Nasser and Henrik ok now I went to try the code for average with different values of constant c

 data = Table[{i, [FT /. sol /. t -> i}, {i, -20, 20, .1}];
  area = Integrate[x[t] /. sol, {t, -20, 20}];
  average = area/(40); 

with this code

Clear[t]
\[Tau] = 13.8;
r = 0.7071;
n = 1.7758;
\[Omega] = 0.5;
k = 1666666.667;
s = 2.2758;
cVals = {2.2758, 2.04822, 1.82064, 1.59306, 1.36548};

color = {Red, Yellow, Green, Cyan, Blue};

Do[c = cVals[[i]]; 
 system1 = {x'[t] == n*y[t], 
   y'[t] == -n*x[t] - c*E^(-(r^2) - ((t^2*(1.177^2))/\[Tau]^2))*z[t], 
   z'[t] == c*E^(-(r^2) - ((t^2*(1.177^2))/\[Tau]^2))*y[t]};
 initialvalues1 = {x[-20] == 0, y[-20] == 0, z[-20] == -1};
 sol1 = NDSolve[
   Join[system1, initialvalues1], {x[t], y[t], z[t]}, {t, -20, 20}];
 F = -s*r*x[t]*E^(-(r^2) - ((t^2*(1.177^2))/\[Tau]^2));
 FT = -c*r*y[t]*E^(-(r^2) - ((t^2*(1.177^2))/\[Tau]^2));

 Subscript[plotF, i] = 
  Plot[Evaluate[F /. sol1], {t, -20, 20}, FrameLabel -> {"t", "F"}, 
   Frame -> True, FrameTicks -> All, PlotStyle -> color[[i]]];
 Subscript[plotFT, i] = 
  Plot[Evaluate[FT /. sol1], {t, -20, 20}, FrameLabel -> {"t", "FT"}, 
   Frame -> True, FrameTicks -> All, PlotStyle -> color[[i]]];, {i, 
  Length[cVals]}] 

Show[{Subscript[plotF, 1], Subscript[plotF, 2], Subscript[plotF, 3], 
  Subscript[plotF, 4], Subscript[plotF, 5]}]
Show[{Subscript[plotFT, 1], Subscript[plotFT, 2], 
  Subscript[plotFT, 3], Subscript[plotFT, 4], Subscript[plotFT, 5]}]

here in this code I have plot FT and F for different values of c (see the photo) and what i want now is plot a variety of different graphs for the average F and FT over the range of c
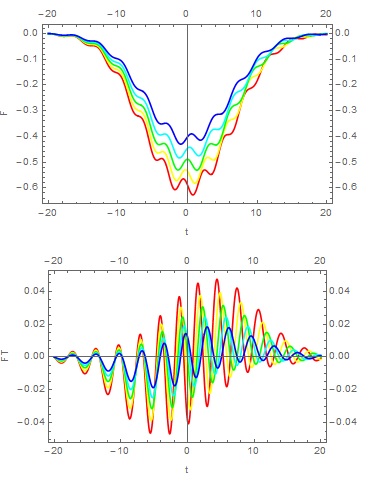
enter image description here

POSTED BY: saysics saja
Reply to this discussion
Community posts can be styled and formatted using the Markdown syntax.
Reply Preview
Attachments
Remove
or Discard

Group Abstract Group Abstract