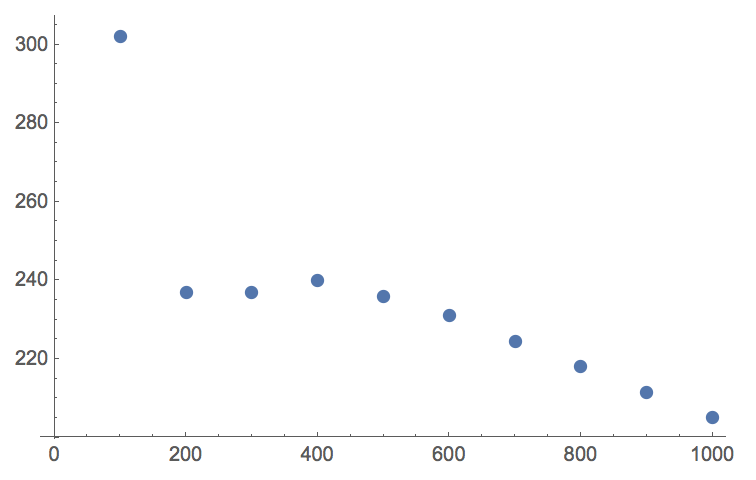
This is not elegant and a bit slow, but
data=Table[WolframAlpha["Thermal Conductivity of Aluminium at " <> ToString[h] <> "K", {{"Result", 1}, "ComputableData"}], {h, 100, 1000, 100}]
appears to be giving results. Here is a plot
ListPlot[Transpose[{Range[100, 1000, 100], QuantityMagnitude@ data}]]
This looks a bit strange to me, but there we go:

Cheers,
M.
I cannot verify the values, but some do not seem to be in total disagreement with, data, e.g. here.