Hi,
not sure whether this helps; it is certainly not the most elegant solution, but it can be generalised. I use a univariate ODE as a test case and I only perform the operation once. This integrates a simple exponential decay until we reach the value 0.1:
sol = NDSolve[{x'[t] == -2 x[t], x[0] == 1, WhenEvent[x[t] == 0.1, "StopIntegration"]}, x, {t, 0, 5}]
We then determine the domain of the interpolating function - otherwise it extrapolates when we plot it.
Needs["DifferentialEquations`InterpolatingFunctionAnatomy`"];
domain = InterpolatingFunctionDomain[First[x /. sol]]
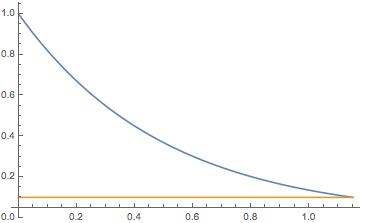
We can then plot the result and the threshold value:
Plot[{x[t] /. sol, 0.1}, {t, 0, domain[[1, 2]]}, PlotRange -> All]
which gives:
I hope that this helps to achieve what you want.
Cheers,
M.


