Message Boards Message Boards

plotting Piecewise function and Circles

Posted 10 years ago

Hi.

How can I graph a piecewise function that includes the equation of a circle/circles?

Best, P.Kay

POSTED BY: P Kay
2 Replies

Hi,

I am not quite sure what exactly you want, but this involves a piecewise function of the equation of circles:

Plot[Piecewise[{{Sqrt[1 - x^2], x < 1}, {Sqrt[1 - (x - 2)^2], x > 1}}], {x, -1, 3}, AspectRatio -> 1/4]

enter image description here

This one also might be a possible answer:

ParametricPlot[Piecewise[{{{Cos[u], Sin[u]}, u < 2 Pi}, {{Cos[u] + 2., Sin[u] + 2.},u > 2 Pi}}], {u, 0, 4 Pi}]
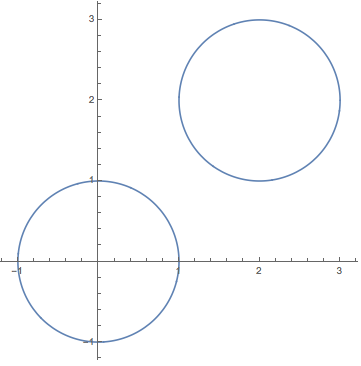
enter image description here

Note that Piecewise has this form

enter image description here

so it does not actually have a slot for the equations for a circle. It needs the values in the form of a function.

Hope this helps,

M.

POSTED BY: Marco Thiel
Posted 10 years ago

Hi Marco, Thank you for taking the time and answering my question. I'm new to Mathematica and this was exactly what I was looking for.

Best regards, P.Kay

POSTED BY: P Kay
Reply to this discussion
Community posts can be styled and formatted using the Markdown syntax.
Reply Preview
Attachments
Remove
or Discard

Group Abstract Group Abstract