Message Boards Message Boards

0
|
5613 Views
|
1 Reply
|
0 Total Likes
View groups...
Share
Share this post:

ListPlot's Filling default Opacity in Mathematica 10

I have found something a bit surprising playing with the Filling options of ListPlot in Mathematica 10. Take a simple example like:

data = Table[{x, x^2}, {x, 1, 5, 0.5}];
data2 = Table[{x + 0.25, x}, {x, 1, 5, 0.5}];
ListPlot[{data, data2}, Filling -> Axis, FillingStyle -> Thick]

So we get something like this:
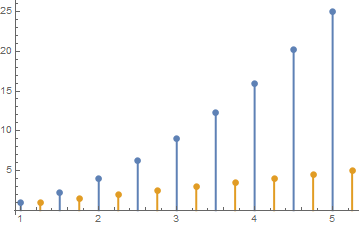
enter image description here

Now if we specify which data sets are to be filled:

ListPlot[{data, data2}, Filling -> {1 -> Axis, 2 -> Axis}, 
 FillingStyle -> {Thick}]

We find that some opacity value has automatically been set:
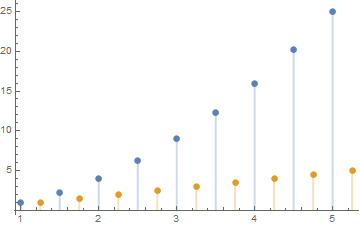
enter image description here

Of course that's no big problem, one can specify the Opacity and the problem is solved:

ListPlot[{data, data2}, Filling -> {1 -> Axis, 2 -> Axis}, 
 FillingStyle -> {Directive[Opacity[1], Thick]}]

The real question is what's the meaning of this behaviour: was intended and why?

Or if you prefer it... bug or feature? =)

I don't see why it would happen either. My guess is that it isn't intentional.

Either way, I've forwarded the example so that it can be resolved if it is an issue. Thank you for pointing this out.

If you come across an issue like this in the future, consider sending it to Wolfram Technical Support (support@wolfram.com). They're the best equipped to determine whether things like these are issues or design quirks. They also can often provide work-arounds in trickier cases.

POSTED BY: Sean Clarke
Reply to this discussion
Community posts can be styled and formatted using the Markdown syntax.
Reply Preview
Attachments
Remove
or Discard

Group Abstract Group Abstract