I have found something a bit surprising playing with the Filling options of ListPlot in Mathematica 10. Take a simple example like:
data = Table[{x, x^2}, {x, 1, 5, 0.5}];
data2 = Table[{x + 0.25, x}, {x, 1, 5, 0.5}];
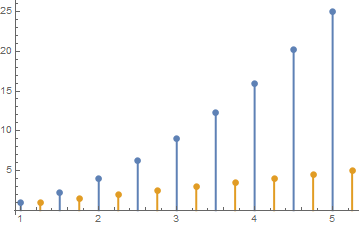
ListPlot[{data, data2}, Filling -> Axis, FillingStyle -> Thick]
So we get something like this:
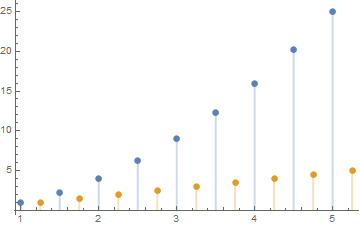
Now if we specify which data sets are to be filled:
ListPlot[{data, data2}, Filling -> {1 -> Axis, 2 -> Axis},
 FillingStyle -> {Thick}]
We find that some opacity value has automatically been set:
Of course that's no big problem, one can specify the Opacity and the problem is solved:
ListPlot[{data, data2}, Filling -> {1 -> Axis, 2 -> Axis},
 FillingStyle -> {Directive[Opacity[1], Thick]}]
The real question is what's the meaning of this behaviour: was intended and why?
Or if you prefer it... bug or feature? =)


