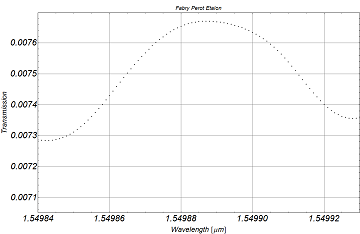
Hey, I would like to fit my experimental results with the Airy function of a Fabry-Perot Etalon.
My data:
FresnelFit1={{1.549839`, 0.007287525118680326`}, {1.5498399999999999`,
  0.00728592444798114`}, {1.549841`,
  0.0072848405971469386`}, {1.549842`,
  0.007284364374582154`}, {1.5498429999999999`,
  0.0072845881201418616`}, {1.549844`,
  0.007285601468836208`}, {1.549845`,
  0.007287487259892552`}, {1.5498459999999998`,
  0.007290317781755396`}, {1.549847`,
  0.007294151518974972`}, {1.549848`,
  0.007299030534781825`}, {1.549849`,
  0.007304978585454492`}, {1.54985`,
  0.007312000021581998`}, {1.5498509999999999`,
  0.007320079489331453`}, {1.549852`,
  0.007329182404157641`}, {1.549853`,
  0.007339256132189752`}, {1.5498539999999998`,
  0.007350231782686882`}, {1.549855`,
  0.0073620264899909`}, {1.549856`,
  0.007374546046404931`}, {1.549857`,
  0.007387687738981427`}, {1.549858`,
  0.007401343243399845`}, {1.5498589999999999`,
  0.007415401436535378`}, {1.54986`,
  0.007429751005089286`}, {1.549861`,
  0.007444282749492882`}, {1.5498619999999999`,
  0.007458891508621713`}, {1.549863`,
  0.007473477659863467`}, {1.549864`,
  0.0074879481788721015`}, {1.5498649999999998`,
  0.007502217272028083`}, {1.549866`,
  0.007516206620454852`}, {1.5498669999999999`,
  0.007529845295892864`}, {1.549868`,
  0.007543069424601624`}, {1.549869`,
  0.007555821684932537`}, {1.5498699999999999`,
  0.007568050726906313`}, {1.549871`,
  0.007579710598101078`}, {1.549872`,
  0.007590760249910437`}, {1.5498729999999998`,
  0.007601163182663397`}, {1.549874`,
  0.007610887268447398`}, {1.549875`,
  0.0076199047682359395`}, {1.549876`,
  0.007628192536747492`}, {1.549877`,
  0.0076357323860610634`}, {1.5498779999999999`,
  0.007642511559038358`}, {1.549879`,
  0.007648523247544408`}, {1.54988`,
  0.007653767079551442`}, {1.5498809999999998`,
  0.007658249494350106`}, {1.549882`,
  0.0076619839267752735`}, {1.549883`,
  0.00766499072964343`}, {1.549884`,
  0.007667296778114667`}, {1.549885`,
  0.007668934719628011`}, {1.5498859999999999`,
  0.007669941857226064`}, {1.549887`,
  0.0076703586809820125`}, {1.549888`,
  0.007670227090141663`}, {1.5498889999999999`,
  0.007669588375646488`}, {1.54989`,
  0.0076684810570517474`}, {1.549891`,
  0.007666938687744237`}, {1.5498919999999998`,
  0.007664987756260431`}, {1.549893`,
  0.007662645818188556`}, {1.5498939999999999`,
  0.007659919991788242`}, {1.549895`,
  0.007656805940720709`}, {1.549896`,
  0.007653287449290181`}, {1.5498969999999999`,
  0.0076493366699958015`}, {1.549898`,
  0.007644915091106534`}, {1.549899`,
  0.007639975234953028`}, {1.5498999999999998`,
  0.007634463057586709`}, {1.549901`,
  0.0076283209795465065`}, {1.549902`,
  0.0076214914379935704`}, {1.549903`,
  0.0076139208147285335`}, {1.549904`,
  0.007605563564776859`}, {1.5499049999999999`,
  0.007596386348249003`}, {1.549906`,
  0.007586371955620281`}, {1.549907`,
  0.007575522814533699`}, {1.5499079999999998`,
  0.007563863875269548`}, {1.549909`,
  0.007551444692124907`}, {1.54991`,
  0.007538340548477009`}, {1.549911`,
  0.007524652513055391`}, {1.549912`,
  0.007510506362171391`}, {1.5499129999999999`,
  0.007496050355147937`}, {1.549914`,
  0.00748145190540724`}, {1.549915`,
  0.007466893244839003`}, {1.5499159999999998`,
  0.007452566231340248`}, {1.549917`,
  0.007438666496015945`}, {1.549918`,
  0.007425387164906448`}, {1.5499189999999998`,
  0.007412912418075339`}, {1.54992`,
  0.007401411164748084`}, {1.5499209999999999`,
  0.007391031115824304`}, {1.549922`,
  0.007381893524037558`}, {1.549923`,
  0.007374088837545597`}, {1.5499239999999999`,
  0.007367673475735633`}, {1.549925`,
  0.007362667888118727`}, {1.549926`,
  0.0073590560005493705`}, {1.5499269999999998`,
  0.00735678609031113`}, {1.549928`,
  0.007355773065882151`}, {1.549929`,
  0.007355902061665628`}, {1.54993`, 0.007357033195909293`}};
My equation is:
n=1.46;
L=0.001002;

model = ((1 - r1^2)*(1 - r2^2))/((1 - r1*r2)^2 +
        4*r1*r2 (Sin[(((2 \[Pi] 10^6)/\[Lambda]) 2 n L  Cos[\[Theta]])/
           2])^2) *I0;
r1 und r2: reflection coefficient for mirrors
n: refraction index
Theta: angle of incident light
Lambda: wavelength
L: length of the etalon
I0: Intensity of incoming beam
Here comes my fit:
nlm = NonlinearModelFit[FresnelFit1, model, {
   {r1, 0.20},
   {r2, 0.20},
   {I0, 0.0077},
   {\[Theta], 2.0}},
  \[Lambda], MaxIterations -> 50001] ;

fit = nlm["BestFitParameters"]

modelf = Normal[nlm]
After evaluation of the code, you will see, that the fitted parameter make absolutly no sense. I dont understand this, because the choosen start values are very close to the true values as it can be seen in the next plot, where I use excatly these start values and compare it with the experimental data (dashed line):
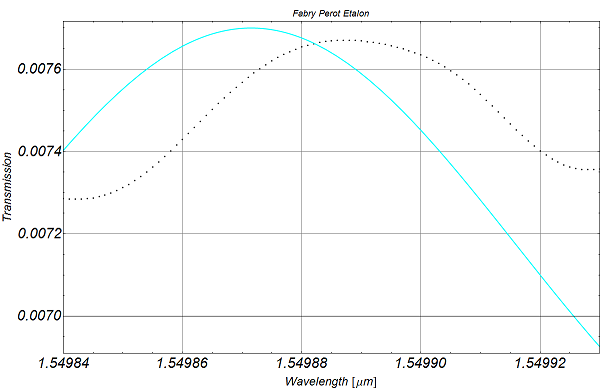
Can somebody tell me what I am doing wrong? Why can Mathematica not fit the experimental curve with this equation?


