Hello
I have a many data points (intensity vs. wavelength). The signal is noisy so I would like to smooth it. The signal is also sumperimposed with another sinusodial function which I try to get rid of. There are some steps where I need you help.
First, here is my long list of data:
Fresnel1 = {{1.549`, 0.004039`}, {1.549002`,
    0.0044009999999999995`}, {1.549004`, 0.003989`}, {1.549006`,
    0.004048`}, {1.5490080000000002`,
    0.0039840000000000006`}, {1.54901`,
    0.0038900000000000002`}, {1.549012`,
    0.0037099999999999998`}, {1.549014`,
    0.003989`}, {1.5490160000000002`, 0.003665`}, {1.549018`,
    0.0035470000000000002`}, {1.54902`,
    0.0035610000000000004`}, {1.549022`,
    0.0036100000000000004`}, {1.549024`,
    0.0033299999999999996`}, {1.549026`,
    0.0036339999999999996`}, {1.549028`, 0.0037`}, {1.54903`,
    0.003268`}, {1.549032`,
    0.0033780000000000004`}, {1.5490340000000002`,
    0.002851`}, {1.549036`, 0.002658`}, {1.5490380000000001`,
    0.0028369999999999997`}, {1.54904`, 0.002932`}, {1.549042`,
    0.0032370000000000003`}, {1.549044`,
    0.002906`}, {1.5490460000000001`, 0.002509`}, {1.549048`,
    0.002802`}, {1.54905`,
    0.0030050000000000003`}, {1.5490519999999999`,
    0.002907`}, {1.5490540000000002`, 0.002761`}, {1.549056`,
    0.002904`}, {1.549058`,
    0.0025680000000000004`}, {1.5490599999999999`,
    0.0028970000000000003`}, {1.549062`,
    0.002852`}, {1.5490640000000002`,
    0.0032010000000000003`}, {1.549066`,
    0.0026899999999999997`}, {1.5490680000000001`,
    0.00326`}, {1.54907`, 0.0034210000000000004`}, {1.549072`,
    0.003198`}, {1.549074`, 0.003453`}, {1.5490760000000001`,
    0.0036339999999999996`}, {1.549078`,
    0.0035499999999999998`}, {1.54908`,
    0.0033729999999999997`}, {1.549082`,
    0.003939`}, {1.5490840000000001`, 0.003859`}, {1.549086`,
    0.0037790000000000002`}, {1.549088`,
    0.0035009999999999998`}, {1.5490899999999999`,
    0.004061`}, {1.5490920000000001`,
    0.003885`}, {1.5490940000000002`, 0.003911`}, {1.549096`,
    0.003969`}, {1.549098`, 0.004259000000000001`}, {1.5491`,
    0.00366`}, {1.5491020000000002`, 0.004077`}, {1.549104`,
    0.003761`}, {1.549106`, 0.0036040000000000004`}, {1.549108`,
    0.00367`}, {1.54911`, 0.003805`}, {1.549112`,
    0.004032`}, {1.549114`, 0.004052`}, {1.549116`,
    0.0036889999999999996`}, {1.549118`,
    0.003642`}, {1.5491199999999998`,
    0.0032199999999999998`}, {1.549122`,
    0.0031160000000000003`}, {1.549124`, 0.003687`}, {1.549126`,
    0.003143`}, {1.549128`, 0.003345`}, {1.5491300000000001`,
    0.003075`}, {1.5491320000000002`,
    0.0029289999999999997`}, {1.549134`,
    0.0032920000000000002`}, {1.549136`,
    0.0030129999999999996`}, {1.549138`,
    0.002542`}, {1.5491400000000002`,
    0.0028150000000000002`}, {1.549142`, 0.00286`}, {1.549144`,
    0.002481`}, {1.549146`, 0.0025619999999999996`}, {1.549148`,
    0.0032990000000000003`}, {1.54915`, 0.00264`}, {1.549152`,
    0.003024`}, {1.549154`, 0.002979`}, {1.549156`,
    0.002856`}, {1.549158`, 0.00313`}, {1.54916`,
    0.00308`}, {1.5491620000000002`, 0.002713`}, {1.549164`,
    0.003175`}, {1.549166`, 0.003362`}, {1.5491679999999999`,
    0.002811`}, {1.5491700000000002`,
    0.0033239999999999997`}, {1.549172`, 0.003183`}, {1.549174`,
    0.003404`}, {1.5491759999999999`,
    0.0036409999999999997`}, {1.5491780000000002`,
    0.003999`}, {1.54918`, 0.004197`}, {1.549182`,
    0.0036530000000000004`}, {1.549184`, 0.003425`}, {1.549186`,
    0.003988`}, {1.5491880000000002`, 0.004108`}, {1.54919`,
    0.003758`}, {1.5491920000000001`, 0.004001`}, {1.549194`,
    0.0042450000000000005`}, {1.549196`, 0.004158`}, {1.549198`,
    0.004176`}, {1.5492000000000001`,
    0.0044729999999999995`}, {1.549202`, 0.003909`}, {1.549204`,
    0.004257`}, {1.5492059999999999`,
    0.0035110000000000002`}, {1.5492080000000001`,
    0.004108`}, {1.54921`, 0.0040219999999999995`}, {1.549212`,
    0.003496`}, {1.5492139999999999`, 0.003723`}, {1.549216`,
    0.0032329999999999998`}, {1.5492180000000002`,
    0.003608`}, {1.54922`, 0.003291`}, {1.549222`,
    0.0031959999999999996`}, {1.549224`,
    0.003361`}, {1.5492260000000002`, 0.00307`}, {1.549228`,
    0.0030610000000000004`}, {1.54923`, 0.003136`}, {1.549232`,
    0.002321`}, {1.549234`, 0.003306`}, {1.549236`,
    0.0027029999999999997`}, {1.5492380000000001`,
    0.0028910000000000003`}, {1.54924`,
    0.0024709999999999997`}, {1.549242`,
    0.0027930000000000003`}, {1.5492439999999998`,
    0.002931`}, {1.5492460000000001`,
    0.003122`}, {1.5492480000000002`, 0.002903`}, {1.54925`,
    0.002682`}, {1.549252`, 0.003185`}, {1.549254`,
    0.002784`}, {1.5492560000000002`,
    0.0029760000000000003`}, {1.549258`,
    0.0033150000000000002`}, {1.54926`,
    0.0031469999999999996`}, {1.549262`, 0.003162`}, {1.549264`,
    0.00332`}, {1.549266`, 0.0033729999999999997`}, {1.549268`,
    0.003173`}, {1.54927`, 0.003736`}, {1.549272`,
    0.00384`}, {1.5492739999999998`, 0.003826`}, {1.549276`,
    0.0038410000000000002`}, {1.5492780000000002`,
    0.004061`}, {1.54928`, 0.0039499999999999995`}, {1.549282`,
    0.003849`}, {1.549284`, 0.003857`}, {1.5492860000000002`,
    0.003908`}, {1.549288`, 0.004143`}, {1.54929`,
    0.003886`}, {1.549292`, 0.004103`}, {1.5492940000000002`,
    0.003975`}, {1.549296`, 0.003981`}, {1.549298`,
    0.004081`}, {1.5493`, 0.004054`}, {1.549302`,
    0.0037920000000000002`}, {1.549304`, 0.003643`}, {1.549306`,
    0.0036390000000000003`}, {1.5493080000000001`,
    0.003553`}, {1.54931`, 0.003966`}, {1.549312`,
    0.0036899999999999997`}, {1.549314`,
    0.0037560000000000002`}, {1.5493160000000001`,
    0.003602`}, {1.549318`, 0.003002`}, {1.54932`,
    0.003593`}, {1.5493219999999999`,
    0.003081`}, {1.5493240000000001`,
    0.0030559999999999997`}, {1.549326`, 0.002919`}, {1.549328`,
    0.0027630000000000003`}, {1.5493299999999999`,
    0.0033150000000000002`}, {1.5493320000000002`,
    0.00316`}, {1.549334`, 0.0030989999999999998`}, {1.549336`,
    0.0029649999999999998`}, {1.549338`, 0.002847`}, {1.54934`,
    0.0031940000000000002`}, {1.5493420000000002`,
    0.0028299999999999996`}, {1.549344`,
    0.002742`}, {1.5493460000000001`, 0.003006`}, {1.549348`,
    0.003117`}, {1.54935`, 0.002649`}, {1.549352`,
    0.003276`}, {1.5493540000000001`,
    0.0031959999999999996`}, {1.549356`,
    0.0031030000000000003`}, {1.549358`,
    0.003258`}, {1.5493599999999998`,
    0.0030979999999999996`}, {1.5493620000000001`,
    0.003313`}, {1.549364`, 0.0033350000000000003`}, {1.549366`,
    0.00362`}, {1.549368`, 0.003985`}, {1.54937`,
    0.004007`}, {1.5493720000000002`,
    0.0039840000000000006`}, {1.549374`, 0.004426`}, {1.549376`,
    0.003764`}, {1.549378`, 0.004008`}, {1.5493800000000002`,
    0.003968`}, {1.549382`, 0.0033659999999999996`}, {1.549384`,
    0.00441`}, {1.549386`, 0.004726`}, {1.549388`,
    0.004397`}, {1.54939`, 0.0040149999999999995`}, {1.549392`,
    0.004045`}, {1.549394`, 0.004139`}, {1.549396`,
    0.003929`}, {1.549398`, 0.003704`}, {1.5494`,
    0.0038299999999999996`}, {1.5494020000000002`,
    0.003814`}, {1.549404`, 0.003248`}, {1.549406`,
    0.003981`}, {1.549408`, 0.003713`}, {1.5494100000000002`,
    0.0035600000000000002`}, {1.549412`, 0.003305`}, {1.549414`,
    0.003353`}, {1.549416`, 0.0034130000000000002`}, {1.549418`,
    0.0033239999999999997`}, {1.54942`, 0.003218`}, {1.549422`,
    0.003017`}, {1.549424`, 0.002808`}, {1.549426`,
    0.003058`}, {1.5494280000000002`, 0.003254`}, {1.54943`,
    0.002741`}, {1.5494320000000001`, 0.002711`}, {1.549434`,
    0.002583`}, {1.549436`, 0.002854`}, {1.549438`,
    0.002683`}, {1.5494400000000002`,
    0.0026290000000000003`}, {1.549442`, 0.002995`}, {1.549444`,
    0.0026`}, {1.5494459999999999`, 0.003129`}, {1.5494480000000002`,
    0.00291`}, {1.54945`, 0.0032379999999999996`}, {1.549452`,
    0.0029330000000000003`}, {1.5494539999999999`,
    0.003017`}, {1.549456`, 0.003073`}, {1.5494580000000002`,
    0.003436`}, {1.54946`,
    0.0034140000000000004`}, {1.5494620000000001`,
    0.003698`}, {1.549464`, 0.003742`}, {1.549466`,
    0.003666`}, {1.549468`, 0.004314`}, {1.5494700000000001`,
    0.004084`}, {1.549472`, 0.003876`}, {1.549474`,
    0.003962`}, {1.549476`, 0.004458`}, {1.5494780000000001`,
    0.004074`}, {1.54948`, 0.004542`}, {1.549482`,
    0.004276`}, {1.5494839999999999`,
    0.004159`}, {1.5494860000000001`,
    0.0041199999999999995`}, {1.5494880000000002`,
    0.003928`}, {1.54949`, 0.003995`}, {1.549492`,
    0.004111999999999999`}, {1.549494`,
    0.004046`}, {1.5494960000000002`, 0.004597`}, {1.549498`,
    0.0042179999999999995`}, {1.5495`,
    0.0037679999999999996`}, {1.549502`,
    0.0032730000000000003`}, {1.549504`,
    0.0035629999999999998`}, {1.549506`,
    0.0037319999999999996`}, {1.549508`, 0.003399`}, {1.54951`,
    0.0036479999999999998`}, {1.549512`,
    0.003459`}, {1.5495139999999998`,
    0.0027449999999999996`}, {1.5495160000000001`,
    0.0031539999999999997`}, {1.549518`, 0.003091`}, {1.54952`,
    0.002762`}, {1.549522`, 0.0028009999999999997`}, {1.549524`,
    0.0029159999999999998`}, {1.5495260000000002`,
    0.003499`}, {1.549528`, 0.002972`}, {1.54953`,
    0.002806`}, {1.549532`, 0.002546`}, {1.5495340000000002`,
    0.003162`}, {1.549536`, 0.002895`}, {1.549538`,
    0.0032329999999999998`}, {1.54954`, 0.003052`}, {1.549542`,
    0.002887`}, {1.549544`, 0.0029820000000000003`}, {1.549546`,
    0.003158`}, {1.549548`, 0.0030499999999999998`}, {1.54955`,
    0.003557`}, {1.549552`, 0.0032730000000000003`}, {1.549554`,
    0.003276`}, {1.5495560000000002`,
    0.0038650000000000004`}, {1.549558`,
    0.0035180000000000003`}, {1.54956`,
    0.0036409999999999997`}, {1.5495619999999999`,
    0.003591`}, {1.5495640000000002`, 0.003608`}, {1.549566`,
    0.00376`}, {1.549568`, 0.004081`}, {1.54957`,
    0.004484`}, {1.549572`, 0.0037860000000000003`}, {1.549574`,
    0.004636`}, {1.549576`, 0.00414`}, {1.549578`,
    0.00462`}, {1.54958`, 0.004448`}, {1.5495820000000002`,
    0.004201`}, {1.549584`, 0.004058`}, {1.5495860000000001`,
    0.004297`}, {1.549588`, 0.004327`}, {1.54959`,
    0.004664`}, {1.549592`,
    0.0038770000000000002`}, {1.5495940000000001`,
    0.004654`}, {1.549596`, 0.004626`}, {1.549598`,
    0.00447`}, {1.5495999999999999`,
    0.0035489999999999996`}, {1.5496020000000001`,
    0.004517`}, {1.549604`, 0.0038650000000000004`}, {1.549606`,
    0.0037730000000000003`}, {1.5496079999999999`,
    0.0037370000000000003`}, {1.54961`,
    0.003212`}, {1.5496120000000002`,
    0.0030979999999999996`}, {1.549614`, 0.003205`}, {1.549616`,
    0.003761`}, {1.549618`, 0.00291`}, {1.54962`,
    0.002704`}, {1.549622`, 0.002859`}, {1.5496240000000001`,
    0.002717`}, {1.549626`, 0.002903`}, {1.549628`,
    0.002668`}, {1.54963`,
    0.0030009999999999998`}, {1.5496320000000001`,
    0.0029219999999999997`}, {1.549634`,
    0.0028799999999999997`}, {1.549636`,
    0.0026179999999999997`}, {1.5496379999999998`,
    0.002777`}, {1.5496400000000001`,
    0.0031349999999999998`}, {1.5496420000000002`,
    0.0028280000000000002`}, {1.549644`, 0.003035`}, {1.549646`,
    0.003034`}, {1.549648`,
    0.0031460000000000004`}, {1.5496500000000002`,
    0.003588`}, {1.549652`, 0.0032449999999999996`}, {1.549654`,
    0.003347`}, {1.549656`, 0.0035830000000000002`}, {1.549658`,
    0.00365`}, {1.54966`, 0.004063`}, {1.549662`,
    0.004287`}, {1.549664`, 0.004208`}, {1.549666`,
    0.0038720000000000004`}, {1.5496679999999998`,
    0.004749`}, {1.54967`, 0.003807`}, {1.5496720000000002`,
    0.004361`}, {1.549674`, 0.004433`}, {1.549676`,
    0.004708`}, {1.549678`, 0.004719`}, {1.5496800000000002`,
    0.0045839999999999995`}, {1.549682`, 0.004565`}, {1.549684`,
    0.004275`}, {1.549686`, 0.004366`}, {1.5496880000000002`,
    0.004244`}, {1.54969`, 0.0039499999999999995`}, {1.549692`,
    0.0038280000000000002`}, {1.549694`, 0.004161`}, {1.549696`,
    0.004089`}, {1.549698`, 0.003901`}, {1.5497`,
    0.003806`}, {1.5497020000000001`,
    0.0036810000000000002`}, {1.549704`,
    0.0037329999999999998`}, {1.549706`,
    0.0038109999999999997`}, {1.549708`,
    0.003783`}, {1.5497100000000001`, 0.003088`}, {1.549712`,
    0.0035190000000000004`}, {1.549714`,
    0.003134`}, {1.5497159999999999`,
    0.0029709999999999997`}, {1.5497180000000002`,
    0.0034029999999999998`}, {1.54972`,
    0.0030559999999999997`}, {1.549722`,
    0.0030120000000000004`}, {1.5497239999999999`,
    0.003045`}, {1.5497260000000002`,
    0.0024200000000000003`}, {1.549728`, 0.003166`}, {1.54973`,
    0.002936`}, {1.549732`, 0.002671`}, {1.549734`,
    0.003039`}, {1.5497360000000002`, 0.002984`}, {1.549738`,
    0.0034270000000000004`}, {1.5497400000000001`,
    0.002923`}, {1.549742`, 0.0030689999999999997`}, {1.549744`,
    0.003231`}, {1.549746`,
    0.0031839999999999998`}, {1.5497480000000001`,
    0.0032`}, {1.54975`, 0.003285`}, {1.549752`,
    0.003548`}, {1.5497539999999999`,
    0.004087`}, {1.5497560000000001`, 0.004124`}, {1.549758`,
    0.0037860000000000003`}, {1.54976`, 0.003748`}, {1.549762`,
    0.004327`}, {1.549764`,
    0.0038599999999999997`}, {1.5497660000000002`,
    0.004447`}, {1.549768`, 0.004155`}, {1.54977`,
    0.0044729999999999995`}, {1.549772`, 0.004628`}, {1.549774`,
    0.004591`}, {1.549776`, 0.004433`}, {1.549778`,
    0.004396`}, {1.54978`, 0.004522`}, {1.549782`,
    0.004259000000000001`}, {1.549784`, 0.004607`}, {1.549786`,
    0.0041129999999999995`}, {1.549788`,
    0.004350000000000001`}, {1.54979`,
    0.004471999999999999`}, {1.549792`,
    0.004462`}, {1.5497940000000001`,
    0.0042109999999999995`}, {1.5497960000000002`,
    0.00404`}, {1.549798`, 0.003602`}, {1.5498`,
    0.00381`}, {1.549802`,
    0.0037329999999999998`}, {1.5498040000000002`,
    0.003425`}, {1.549806`, 0.003078`}, {1.549808`,
    0.003162`}, {1.54981`, 0.003121`}, {1.549812`,
    0.003081`}, {1.549814`, 0.002797`}, {1.549816`,
    0.002816`}, {1.549818`, 0.0032259999999999997`}, {1.54982`,
    0.00315`}, {1.5498219999999998`, 0.002981`}, {1.549824`,
    0.003314`}, {1.5498260000000001`, 0.002832`}, {1.549828`,
    0.002895`}, {1.54983`, 0.003305`}, {1.549832`,
    0.003073`}, {1.5498340000000002`, 0.002943`}, {1.549836`,
    0.0035009999999999998`}, {1.549838`,
    0.0035139999999999998`}, {1.5498399999999999`,
    0.003718`}, {1.5498420000000002`, 0.003176`}, {1.549844`,
    0.0037790000000000002`}, {1.549846`, 0.003691`}, {1.549848`,
    0.003663`}, {1.54985`, 0.004065`}, {1.5498520000000002`,
    0.0038179999999999998`}, {1.549854`,
    0.0036220000000000002`}, {1.5498560000000001`,
    0.004888`}, {1.549858`, 0.003833`}, {1.54986`,
    0.004`}, {1.549862`, 0.003917`}, {1.5498640000000001`,
    0.0043939999999999995`}, {1.549866`, 0.004491`}, {1.549868`,
    0.00427`}, {1.5498699999999999`, 0.004424`}, {1.5498720000000001`,
     0.004517`}, {1.549874`, 0.0042380000000000004`}, {1.549876`,
    0.004716000000000001`}, {1.5498779999999999`,
    0.004366`}, {1.5498800000000001`,
    0.004001`}, {1.5498820000000002`, 0.004846`}, {1.549884`,
    0.004094`}, {1.549886`, 0.003928`}, {1.549888`,
    0.0039900000000000005`}, {1.5498900000000002`,
    0.003949`}, {1.549892`, 0.0037070000000000002`}, {1.549894`,
    0.003932`}, {1.549896`, 0.003546`}, {1.549898`,
    0.0035559999999999997`}, {1.5499`,
    0.0032860000000000003`}, {1.5499020000000001`,
    0.003009`}, {1.549904`, 0.002985`}, {1.549906`,
    0.0034289999999999998`}, {1.5499079999999998`,
    0.002912`}, {1.5499100000000001`, 0.003041`}, {1.549912`,
    0.0030540000000000003`}, {1.549914`, 0.00327`}, {1.549916`,
    0.002179`}, {1.549918`, 0.002694`}, {1.5499200000000002`,
    0.0033229999999999996`}, {1.549922`, 0.002383`}, {1.549924`,
    0.002896`}, {1.549926`, 0.003397`}, {1.5499280000000002`,
    0.003219`}, {1.54993`, 0.0031469999999999996`}, {1.549932`,
    0.003256`}, {1.549934`, 0.003702`}, {1.549936`,
    0.003235`}, {1.549938`, 0.003564`}, {1.54994`,
    0.00365`}, {1.549942`, 0.003578`}, {1.549944`,
    0.00398`}, {1.549946`, 0.004131`}, {1.549948`,
    0.003993`}, {1.5499500000000002`, 0.004268`}, {1.549952`,
    0.004006`}, {1.549954`, 0.00422`}, {1.549956`,
    0.004522`}, {1.5499580000000002`,
    0.0043879999999999995`}, {1.54996`, 0.004298`}, {1.549962`,
    0.004351`}, {1.549964`, 0.004876`}, {1.549966`,
    0.004407`}, {1.549968`, 0.0045`}, {1.54997`,
    0.0048660000000000005`}, {1.549972`, 0.004641`}, {1.549974`,
    0.004348`}, {1.5499760000000002`,
    0.0044599999999999996`}, {1.549978`,
    0.004335`}, {1.5499800000000001`, 0.003918`}, {1.549982`,
    0.0041129999999999995`}, {1.549984`, 0.00394`}, {1.549986`,
    0.00409`}, {1.5499880000000001`, 0.004176`}, {1.54999`,
    0.0038150000000000002`}, {1.549992`,
    0.0035050000000000003`}, {1.5499939999999999`,
    0.0039299999999999995`}, {1.5499960000000002`,
    0.003812`}, {1.549998`, 0.003515`}, {1.55`,
    0.003193`}, {1.5500019999999999`,
    0.0035110000000000002`}, {1.550004`,
    0.002833`}, {1.5500060000000002`, 0.0026`}, {1.550008`,
    0.002917`}, {1.55001`, 0.0035069999999999997`}, {1.550012`,
    0.0028239999999999997`}, {1.550014`,
    0.0029330000000000003`}, {1.550016`,
    0.002772`}, {1.5500180000000001`, 0.003118`}, {1.55002`,
    0.002608`}, {1.550022`,
    0.0030559999999999997`}, {1.5500239999999998`,
    0.00272`}, {1.5500260000000001`, 0.003006`}, {1.550028`,
    0.00314`}, {1.55003`,
    0.0036969999999999998`}, {1.5500319999999999`,
    0.003564`}, {1.5500340000000001`, 0.00332`}, {1.5500360000000002`,
     0.003723`}, {1.550038`, 0.003753`}, {1.55004`,
    0.003869`}, {1.550042`, 0.004578`}, {1.5500440000000002`,
    0.004129`}, {1.550046`, 0.003906`}, {1.550048`,
    0.004231`}, {1.55005`, 0.004319`}, {1.550052`,
    0.0049110000000000004`}, {1.550054`,
    0.0043560000000000005`}, {1.550056`, 0.004688`}, {1.550058`,
    0.004452`}, {1.55006`,
    0.0048660000000000005`}, {1.5500619999999998`,
    0.004797`}, {1.550064`, 0.005202`}, {1.5500660000000002`,
    0.0047599999999999995`}, {1.550068`, 0.004744`}, {1.55007`,
    0.004644`}, {1.550072`, 0.004598`}, {1.5500740000000002`,
    0.004531`}, {1.550076`, 0.004447`}, {1.550078`,
    0.00441`}, {1.55008`, 0.004547`}, {1.5500820000000002`,
    0.003949`}, {1.550084`, 0.003851`}, {1.550086`,
    0.003854`}, {1.550088`, 0.004209`}, {1.55009`,
    0.003981`}, {1.550092`, 0.00345`}, {1.550094`,
    0.0038640000000000002`}, {1.5500960000000001`,
    0.0035139999999999998`}, {1.550098`, 0.003004`}, {1.5501`,
    0.0032870000000000004`}, {1.550102`,
    0.003251`}, {1.5501040000000001`, 0.003166`}, {1.550106`,
    0.003227`}, {1.550108`,
    0.0031520000000000003`}, {1.5501099999999999`,
    0.003143`}, {1.5501120000000002`,
    0.0028669999999999998`}, {1.550114`, 0.003347`}, {1.550116`,
    0.002762`}, {1.5501179999999999`, 0.002807`}, {1.55012`,
    0.0031899999999999997`}, {1.550122`, 0.002974`}, {1.550124`,
    0.003183`}, {1.5501260000000001`, 0.003434`}, {1.550128`,
    0.0037930000000000004`}, {1.5501300000000002`,
    0.003255`}, {1.550132`, 0.003593`}, {1.5501340000000001`,
    0.0034490000000000002`}, {1.550136`, 0.003301`}, {1.550138`,
    0.003531`}, {1.55014`,
    0.0038169999999999996`}, {1.5501420000000001`,
    0.004512`}, {1.550144`, 0.0044729999999999995`}, {1.550146`,
    0.004127`}, {1.5501479999999999`,
    0.004301`}, {1.5501500000000001`,
    0.0044729999999999995`}, {1.550152`, 0.004637`}, {1.550154`,
    0.004787`}, {1.550156`, 0.00486`}, {1.550158`,
    0.004733`}, {1.5501600000000002`,
    0.0049110000000000004`}, {1.550162`, 0.00448`}, {1.550164`,
    0.004463`}, {1.550166`, 0.005001`}, {1.550168`,
    0.004928999999999999`}, {1.55017`, 0.004504`}, {1.550172`,
    0.004333`}, {1.550174`, 0.004704`}, {1.550176`,
    0.004325`}, {1.550178`,
    0.004069000000000001`}, {1.5501800000000001`,
    0.0040620000000000005`}, {1.550182`, 0.004186`}, {1.550184`,
    0.0042179999999999995`}, {1.550186`,
    0.004118999999999999`}, {1.5501880000000001`,
    0.004079`}, {1.5501900000000002`, 0.003402`}, {1.550192`,
    0.003296`}, {1.550194`, 0.0033290000000000004`}, {1.550196`,
    0.0038239999999999997`}, {1.5501980000000002`,
    0.003077`}, {1.5502`, 0.003192`}, {1.550202`,
    0.002995`}, {1.550204`, 0.0030129999999999996`}, {1.550206`,
    0.0031049999999999997`}, {1.550208`, 0.002918`}, {1.55021`,
    0.0032020000000000004`}, {1.550212`, 0.003445`}, {1.550214`,
    0.003034`}, {1.5502159999999998`, 0.003365`}, {1.550218`,
    0.0029340000000000004`}, {1.5502200000000002`,
    0.0035559999999999997`}, {1.550222`,
    0.0030629999999999998`}, {1.550224`,
    0.0033729999999999997`}, {1.550226`,
    0.00329`}, {1.5502280000000002`, 0.003814`}, {1.55023`,
    0.0037459999999999998`}, {1.550232`, 0.003938`}, {1.550234`,
    0.004159`}, {1.5502360000000002`, 0.004087`}, {1.550238`,
    0.004393`}, {1.55024`, 0.004533000000000001`}, {1.550242`,
    0.004476`}, {1.550244`,
    0.0051519999999999995`}, {1.5502460000000002`,
    0.004716000000000001`}, {1.550248`,
    0.004849`}, {1.5502500000000001`, 0.00512`}, {1.550252`,
    0.004598`}, {1.550254`, 0.004934`}, {1.550256`,
    0.004901`}, {1.5502580000000001`,
    0.004520000000000001`}, {1.55026`,
    0.0050539999999999995`}, {1.550262`,
    0.004658`}, {1.5502639999999999`,
    0.005123999999999999`}, {1.5502660000000001`,
    0.004493`}, {1.550268`, 0.004328`}, {1.55027`,
    0.004712`}, {1.5502719999999999`, 0.004451`}, {1.550274`,
    0.004899`}, {1.5502760000000002`, 0.004477`}, {1.550278`,
    0.004901`}, {1.55028`, 0.003985`}, {1.550282`,
    0.004228`}, {1.5502840000000002`, 0.004041`}, {1.550286`,
    0.0038770000000000002`}, {1.550288`, 0.003827`}, {1.55029`,
    0.003407`}, {1.550292`, 0.003363`}, {1.550294`,
    0.003499`}, {1.5502960000000001`, 0.00316`}, {1.550298`,
    0.003006`}, {1.5503`, 0.003532`}, {1.5503019999999998`,
    0.003278`}, {1.5503040000000001`,
    0.0033780000000000004`}, {1.550306`,
    0.0034260000000000002`}, {1.550308`, 0.003277`}, {1.55031`,
    0.0034140000000000004`}, {1.550312`,
    0.0029779999999999997`}, {1.5503140000000002`,
    0.0031539999999999997`}, {1.550316`, 0.003606`}, {1.550318`,
    0.003394`}, {1.55032`, 0.003407`}, {1.550322`,
    0.003268`}, {1.550324`, 0.003919`}, {1.550326`,
    0.004109`}, {1.550328`, 0.003988`}, {1.55033`,
    0.003982`}, {1.550332`, 0.004607`}, {1.550334`,
    0.004129`}, {1.550336`, 0.004249`}, {1.550338`,
    0.0046040000000000005`}, {1.55034`,
    0.0048449999999999995`}, {1.550342`,
    0.004686`}, {1.5503440000000002`,
    0.0048839999999999995`}, {1.550346`, 0.004986`}, {1.550348`,
    0.005252`}, {1.55035`,
    0.0051470000000000005`}, {1.5503520000000002`,
    0.004981`}, {1.550354`, 0.0052109999999999995`}, {1.550356`,
    0.005327`}, {1.550358`, 0.005136000000000001`}, {1.55036`,
    0.004724`}, {1.550362`, 0.004822`}, {1.550364`,
    0.004936`}, {1.550366`, 0.0046429999999999996`}, {1.550368`,
    0.004301`}, {1.55037`, 0.004716000000000001`}, {1.550372`,
    0.0043300000000000005`}, {1.5503740000000001`,
    0.004248`}, {1.550376`, 0.004345`}, {1.550378`,
    0.0039700000000000004`}, {1.55038`,
    0.004272`}, {1.5503820000000001`, 0.003749`}, {1.550384`,
    0.0033789999999999996`}, {1.550386`,
    0.0033719999999999996`}, {1.5503879999999999`,
    0.0033150000000000002`}, {1.5503900000000002`,
    0.003594`}, {1.550392`, 0.003349`}, {1.550394`,
    0.003242`}, {1.5503959999999999`, 0.003455`}, {1.550398`,
    0.0026039999999999995`}, {1.5504000000000002`,
    0.0031390000000000003`}, {1.550402`,
    0.0032389999999999997`}, {1.5504040000000001`,
    0.003428`}, {1.550406`, 0.0031119999999999997`}, {1.550408`,
    0.00332`}, {1.55041`, 0.003219`}, {1.5504120000000001`,
    0.003327`}, {1.550414`, 0.003906`}, {1.550416`,
    0.00354`}, {1.5504179999999999`,
    0.0036100000000000004`}, {1.5504200000000001`,
    0.003538`}, {1.550422`, 0.004029`}, {1.550424`,
    0.004048`}, {1.5504259999999999`, 0.00392`}, {1.5504280000000001`,
     0.004313`}, {1.5504300000000002`, 0.004574`}, {1.550432`,
    0.004423`}, {1.550434`, 0.004953000000000001`}, {1.550436`,
    0.004795000000000001`}, {1.5504380000000002`,
    0.005261`}, {1.55044`, 0.005202`}, {1.550442`,
    0.005110999999999999`}, {1.550444`, 0.005529`}, {1.550446`,
    0.005684000000000001`}, {1.550448`, 0.004885`}, {1.55045`,
    0.005055`}, {1.550452`, 0.0054789999999999995`}, {1.550454`,
    0.005103`}, {1.5504559999999998`,
    0.005247`}, {1.5504580000000001`,
    0.005411`}, {1.5504600000000002`, 0.005183`}, {1.550462`,
    0.005537`}, {1.550464`, 0.005024000000000001`}, {1.550466`,
    0.004418`}, {1.5504680000000002`, 0.004732`}, {1.55047`,
    0.004641`}, {1.550472`, 0.004118999999999999`}, {1.550474`,
    0.004379`}, {1.5504760000000002`, 0.004042`}, {1.550478`,
    0.004169`}, {1.55048`, 0.0040550000000000004`}, {1.550482`,
    0.003672`}, {1.550484`, 0.00379`}, {1.550486`,
    0.003589`}, {1.550488`, 0.003767`}, {1.5504900000000001`,
    0.00349`}, {1.550492`, 0.003023`}, {1.550494`,
    0.0035499999999999998`}, {1.550496`,
    0.0034630000000000004`}, {1.5504980000000002`,
    0.003057`}, {1.5505`, 0.003523`}, {1.550502`,
    0.003227`}, {1.5505039999999999`, 0.00312`}, {1.5505060000000002`,
     0.003735`}, {1.550508`, 0.00365`}, {1.55051`,
    0.003649`}, {1.550512`, 0.003808`}, {1.550514`,
    0.0036479999999999998`}, {1.550516`, 0.003565`}, {1.550518`,
    0.0035139999999999998`}, {1.5505200000000001`,
    0.003981`}, {1.550522`, 0.004544`}, {1.550524`,
    0.004099`}, {1.550526`, 0.004478`}, {1.5505280000000001`,
    0.004739999999999999`}, {1.55053`, 0.004612`}, {1.550532`,
    0.005204`}, {1.550534`, 0.004924`}, {1.5505360000000001`,
    0.005193000000000001`}, {1.550538`, 0.004897`}, {1.55054`,
    0.00497`}, {1.5505419999999999`, 0.005203`}, {1.5505440000000001`,
     0.005404000000000001`}, {1.550546`, 0.005699`}, {1.550548`,
    0.005931`}, {1.55055`, 0.005901`}, {1.550552`,
    0.004959`}, {1.5505540000000002`,
    0.005052000000000001`}, {1.550556`, 0.005338`}, {1.550558`,
    0.005173`}, {1.55056`, 0.005137999999999999`}, {1.550562`,
    0.0047090000000000005`}, {1.550564`, 0.005119`}, {1.550566`,
    0.004792`}, {1.550568`, 0.004631`}, {1.55057`,
    0.00482`}, {1.5505719999999998`, 0.004187`}, {1.5505740000000001`,
     0.0043230000000000005`}, {1.550576`, 0.004203`}, {1.550578`,
    0.0038280000000000002`}, {1.55058`,
    0.004114`}, {1.5505820000000001`,
    0.0034519999999999998`}, {1.5505840000000002`,
    0.003933`}, {1.550586`, 0.0037199999999999998`}, {1.550588`,
    0.003453`}, {1.55059`, 0.003728`}, {1.5505920000000002`,
    0.0032749999999999997`}, {1.550594`,
    0.0033900000000000002`}, {1.550596`,
    0.0034709999999999997`}, {1.550598`, 0.003447`}, {1.5506`,
    0.0037`}, {1.550602`, 0.003698`}, {1.550604`,
    0.003895`}, {1.550606`, 0.003885`}, {1.550608`,
    0.004019`}, {1.5506099999999998`,
    0.0043159999999999995`}, {1.550612`,
    0.0037259999999999997`}, {1.5506140000000002`,
    0.004452`}, {1.550616`, 0.004482`}, {1.550618`,
    0.004237`}, {1.5506199999999999`,
    0.004822`}, {1.5506220000000002`,
    0.004471999999999999`}, {1.550624`, 0.005089`}, {1.550626`,
    0.0048070000000000005`}, {1.550628`,
    0.005204`}, {1.5506300000000002`, 0.005472`}, {1.550632`,
    0.005231`}, {1.550634`, 0.005435`}, {1.550636`,
    0.005347`}, {1.550638`,
    0.0053939999999999995`}, {1.5506400000000002`,
    0.005678`}, {1.550642`,
    0.005489000000000001`}, {1.5506440000000001`,
    0.005795`}, {1.550646`, 0.005797`}, {1.550648`,
    0.005499`}, {1.55065`,
    0.005588999999999999`}, {1.5506520000000001`,
    0.005628`}, {1.550654`, 0.005604`}, {1.550656`,
    0.005312`}, {1.5506579999999999`,
    0.005244`}, {1.5506600000000001`, 0.005178`}, {1.550662`,
    0.004962`}, {1.550664`,
    0.004856999999999999`}, {1.5506659999999999`,
    0.004852`}, {1.550668`, 0.00467`}, {1.5506700000000002`,
    0.004144`}, {1.550672`, 0.00454`}, {1.550674`,
    0.004137`}, {1.550676`, 0.00404`}, {1.5506780000000002`,
    0.003935999999999999`}, {1.55068`,
    0.003854`}, {1.5506820000000001`, 0.003813`}, {1.550684`,
    0.003856`}, {1.550686`, 0.003983`}, {1.550688`,
    0.0036959999999999996`}, {1.5506900000000001`,
    0.0038309999999999998`}, {1.550692`, 0.003657`}, {1.550694`,
    0.003679`}, {1.5506959999999999`,
    0.003999`}, {1.5506980000000001`, 0.003959`}, {1.5507`,
    0.004504`}, {1.550702`, 0.003922`}, {1.550704`,
    0.004137`}, {1.550706`, 0.004287`}, {1.5507080000000002`,
    0.0043230000000000005`}, {1.55071`, 0.0045`}, {1.550712`,
    0.004432`}, {1.550714`, 0.00482`}, {1.550716`,
    0.004631`}, {1.550718`, 0.004501`}, {1.55072`,
    0.0053349999999999995`}, {1.550722`,
    0.005124999999999999`}, {1.550724`, 0.005372`}, {1.550726`,
    0.005689`}, {1.550728`, 0.005597`}, {1.55073`,
    0.005523`}, {1.550732`, 0.005703`}, {1.550734`,
    0.005704`}, {1.5507360000000001`,
    0.005915`}, {1.5507380000000002`,
    0.0063349999999999995`}, {1.55074`, 0.006132`}, {1.550742`,
    0.005475000000000001`}, {1.550744`,
    0.005865`}, {1.5507460000000002`, 0.005744`}, {1.550748`,
    0.00589`}, {1.55075`, 0.006239`}, {1.550752`,
    0.005875`}, {1.550754`, 0.005279`}, {1.550756`,
    0.005981`}, {1.550758`, 0.00553`}, {1.55076`,
    0.004985`}, {1.550762`, 0.004737`}, {1.550764`,
    0.004770999999999999`}, {1.550766`,
    0.004471999999999999`}, {1.5507680000000001`,
    0.004578`}, {1.55077`, 0.004552`}, {1.550772`,
    0.00456`}, {1.5507739999999999`, 0.004294`}, {1.5507760000000002`,
     0.0043089999999999995`}, {1.550778`, 0.004178`}, {1.55078`,
    0.004138`}, {1.5507819999999999`,
    0.004202`}, {1.5507840000000002`, 0.003659`}, {1.550786`,
    0.0042650000000000006`}, {1.550788`, 0.003857`}, {1.55079`,
    0.003876`}, {1.550792`, 0.003874`}, {1.5507940000000002`,
    0.004008`}, {1.550796`,
    0.003991000000000001`}, {1.5507980000000001`,
    0.004051`}, {1.5508`, 0.004248`}, {1.550802`,
    0.004538`}, {1.550804`, 0.004512`}, {1.5508060000000001`,
    0.0046040000000000005`}, {1.550808`, 0.004518`}, {1.55081`,
    0.005279`}, {1.5508119999999999`,
    0.005046`}, {1.5508140000000001`,
    0.0052060000000000006`}, {1.550816`, 0.00514`}, {1.550818`,
    0.005427`}, {1.5508199999999999`, 0.005553`}, {1.550822`,
    0.005736`}, {1.5508240000000002`, 0.005881`}, {1.550826`,
    0.005976`}, {1.550828`, 0.005829`}, {1.55083`,
    0.0064789999999999995`}, {1.5508320000000002`,
    0.006341`}, {1.550834`, 0.00631`}, {1.550836`,
    0.006294999999999999`}, {1.550838`, 0.006432`}, {1.55084`,
    0.006353`}, {1.550842`, 0.006434`}, {1.5508440000000001`,
    0.006229`}, {1.550846`, 0.006220000000000001`}, {1.550848`,
    0.005959`}, {1.5508499999999998`,
    0.005971`}, {1.5508520000000001`,
    0.005587999999999999`}, {1.5508540000000002`,
    0.0057599999999999995`}, {1.550856`, 0.00534`}, {1.550858`,
    0.005574999999999999`}, {1.55086`,
    0.005320000000000001`}, {1.5508620000000002`,
    0.0052239999999999995`}, {1.550864`, 0.005076`}, {1.550866`,
    0.004818`}, {1.550868`, 0.004404`}, {1.55087`,
    0.00428`}, {1.550872`, 0.0042109999999999995`}, {1.550874`,
    0.004575`}, {1.550876`, 0.004246`}, {1.550878`,
    0.0041069999999999995`}, {1.55088`, 0.004098`}, {1.550882`,
    0.004111`}, {1.5508840000000002`,
    0.0038350000000000003`}, {1.550886`, 0.004174`}, {1.550888`,
    0.00366`}, {1.55089`, 0.003917`}, {1.5508920000000002`,
    0.003944`}, {1.550894`, 0.0038239999999999997`}, {1.550896`,
    0.0044410000000000005`}, {1.5508979999999999`,
    0.004257`}, {1.5509000000000002`, 0.004762`}, {1.550902`,
    0.00468`}, {1.550904`, 0.0049900000000000005`}, {1.550906`,
    0.004981`}, {1.550908`, 0.004887`}, {1.55091`,
    0.004873`}, {1.550912`, 0.00535`}, {1.5509140000000001`,
    0.005199`}, {1.550916`, 0.005637`}, {1.550918`,
    0.005841999999999999`}, {1.55092`,
    0.006037000000000001`}, {1.5509220000000001`,
    0.006187`}, {1.550924`, 0.005757999999999999`}, {1.550926`,
    0.006293999999999999`}, {1.550928`,
    0.006074`}, {1.5509300000000001`, 0.006434`}, {1.550932`,
    0.006825`}, {1.550934`, 0.006494`}, {1.5509359999999999`,
    0.006422`}, {1.5509380000000001`,
    0.006964000000000001`}, {1.55094`,
    0.006646999999999999`}, {1.550942`, 0.006372`}, {1.550944`,
    0.006606`}, {1.550946`, 0.006429`}, {1.5509480000000002`,
    0.006417`}, {1.55095`, 0.005962`}, {1.550952`,
    0.005801`}, {1.550954`, 0.005922`}, {1.550956`,
    0.005497`}, {1.550958`,
    0.0052959999999999995`}, {1.5509600000000001`,
    0.005173`}, {1.550962`, 0.005511`}, {1.550964`,
    0.005078`}, {1.5509659999999998`,
    0.004787`}, {1.5509680000000001`, 0.00434`}, {1.55097`,
    0.004545`}, {1.550972`, 0.004674`}, {1.550974`,
    0.004266`}, {1.5509760000000001`,
    0.004365`}, {1.5509780000000002`, 0.004633`}, {1.55098`,
    0.003992`}, {1.550982`, 0.003719`}, {1.550984`,
    0.004054`}, {1.5509860000000002`,
    0.0047409999999999996`}, {1.550988`, 0.004286`}};
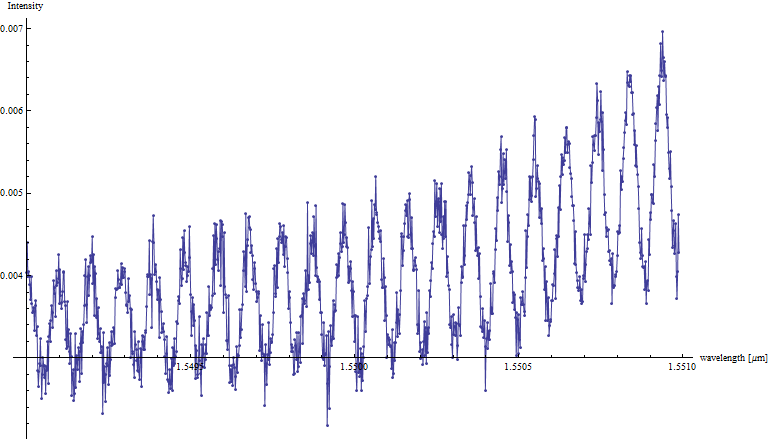
As you can see the data is quite noisy and the signal is superimposed with another sinus:
Show[
 ListPlot[Fresnel1, AxesLabel -> {"wavelength [\[Mu]m]", "Intensity"}],
 ListLinePlot[Fresnel1, PlotStyle -> {Thin, PointSize[0.1]},
  AxesLabel -> {"wavelength [\[Mu]m]", "Intensity"}]
 ]
What I want to do is:
1.) Filter the sinus with smaller frequency out of my signal
2.) Smooth my signal by filtering the noise
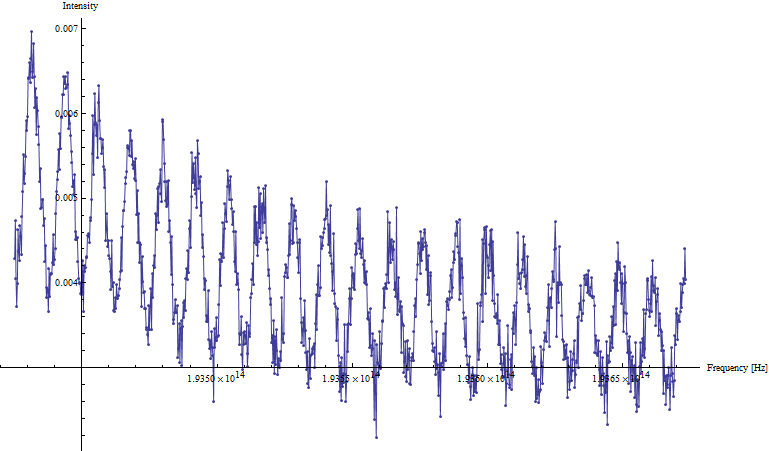
As far as I understand the FFT I have to convert my signal from wavelength into frequency. Then I can apply the Mathematica functions Fourier[] and InverseFourier[] to filter my signal. But I think there is one important think to keep in mind and this is why I need your help.
If I convert the wavelength signal to frequency, the step size changes (is not equal anymore: delta lambda compared to delta frequency). And I have heard that this is important. First of all, is this actually correct? If yes, can you explain me why or where I can find more information about it? I think I have to define a wavelength array. How does this look like?
Fi = First[Dimensions [Fresnel1]];
FresnelFrequency1 =
  Table[{(3*10^8)/Fresnel1[[t, 1]]*10^6, Fresnel1[[t, 2]]}, {t,
    Fi}];

Show[
 ListPlot[FresnelFrequency1,
  AxesLabel -> {"Frequency [Hz]", "Intensity"}],
 ListLinePlot[FresnelFrequency1, PlotStyle -> {Thin, PointSize[0.1]},
  AxesLabel -> {"Frequency [Hz]", "Intensity"}]
 ]
Because I think I have to deal with this sort of problem more often in the future, how would you solve step (1) and step (2) ?
Hope you can help me.
Peter


