Message Boards Message Boards

2
|
11371 Views
|
8 Replies
|
6 Total Likes
View groups...
Share
Share this post:

Extracting mesh coordinates from a Plot3D

Posted 10 years ago

I have function which I can plot with the Plot3D utility. Here's the equation:.

Plot3D[{If[x^2 + y^2 > 1, h = 0, h = (Cos[(y \[Pi])/2] Cos[(x \[Pi])/2])^0.5]}, {x, 2, -2}, {y, 2, -2}]

I can see the rectangular mesh on the plot. How can I export the coordinates of those mesh intersections as a text array of numeric triples?

POSTED BY: Skip Cave
8 Replies
Posted 10 years ago
f[x_, y_] :=   If[x^2 + y^2 > 1, h = 0,    h = (Cos[(y \[Pi])/2] Cos[(x \[Pi])/2])^0.5];

Plot3D[f[x, y], {x, 2, -2}, {y, 2, -2}]

Extracting them may be complicated because those intersections are not calculated. Mesh lines are done for each direction separately.

But you can easily create them by yourself:

Array[{##, f[##]} &, {17, 17}, {{-2, 2}, {-2, 2}}]
Graphics3D[   Point /@ % ]
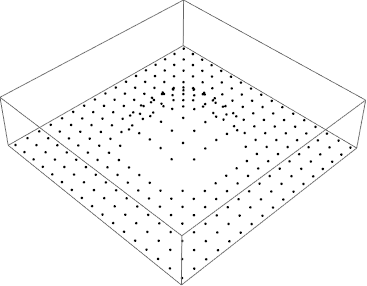
enter image description here

On the other hand you can extract actual plot polygons verices:

Plot3D[{If[x^2 + y^2 > 1, h = 0, 
   h = (Cos[(y \[Pi])/2] Cos[(x \[Pi])/2])^0.5]}, {x, 2, -2}, {y, 
  2, -2}, Mesh -> None, 
 PlotStyle -> Directive[EdgeForm[Thick], FaceForm@None]
 ]

% // Cases[#, GraphicsComplex[pts_, ___] :> pts] & // Short
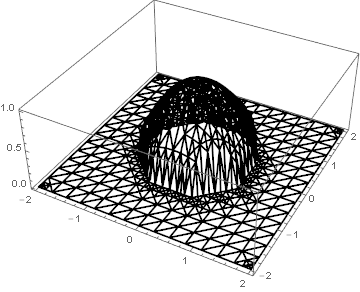
enter image description here

{{{-2.,-2.,0.}, <<562>>,{<<1>>}}}

Or use V10 fancy stuff:

DiscretizeGraphics @  First @ Normal @    Plot3D[ f[x,y], {x, 2, -2}, {y,   2, -2}, Mesh -> None]

MeshCoordinates@% // Shallow
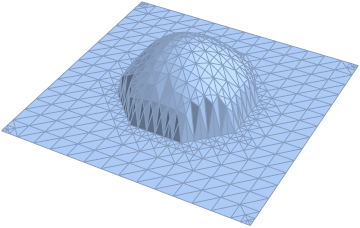
enter image description here {{-1.85714,-1.85714,0.},{-1.71429,-2.,0.},{-1.71429,-1.71429,0.},{0.,-1.71429,0.},{-0.285714,-2.,0.},{0.,-2.,0.},{-1.42857,-1.71429,0.},{-1.42857,-2.,0.},{-1.14286,-1.71429,0.},{-1.14286,-2.,0.},<<554>>}

POSTED BY: Kuba Podkalicki
Posted 10 years ago

You can just write pts = Array[.... and than Graphics3D[ Point /@ pts]. Character % is the last output. Take a look at Out documentation.

You can switch to finite precission by N @ pts

About converting them to the list of triplets, you can do: Join @@ pts or Flatten[ pts, 1].

About exporting, probably Export["file.txt", Join@@pts, "Table"] or something like that, can't check now.

Good luck.

POSTED BY: Kuba Podkalicki
Posted 10 years ago

Not sure how this is related to the topic, maybe you can use this:

Manipulate[
 Graphics3D[
  {Scale[Sphere[{0, 0, 0}, 1], {a, b, c}],
   Point@{0, 0, 0}}
  ,
  PlotRange -> 2, ClipPlanes -> {{0, 0, 1, 0}}, 
  ClipPlanesStyle -> Opacity@.5
  ]
 ,
 {a, 1, 2},
 {b, 1, 2},
 {c, 1, 2}
 ]

enter image description here

POSTED BY: Kuba Podkalicki
Posted 10 years ago

You can't put Texture on Sphere but we can create our own sphere :)

i = Import["http://jan.ucc.nau.edu/~rcb7/370moll.jpg"];

map = Colorize[(GeodesicDilation[  MorphologicalBinarize[#, {0.35, Automatic}], #, 3] &[i]), 
   ColorFunction -> "BlueGreenYellow"];

sphere = First @ SphericalPlot3D[1, {u, 0, Pi}, {v, 0, 2 Pi}, Mesh -> None,  TextureCoordinateFunction -> ({#5, 1 - #4} &), 
                                                      PerformanceGoal -> "Quality", PlotStyle -> Directive[Specularity[White, 10], Texture[map]], 
                                                       Lighting -> "Neutral", Axes -> False, RotationAction -> "Clip",  Boxed -> False]

You can find more explanation here: [...] projection onto a sphere?

Manipulate[
 Graphics3D[{Scale[sphere , {a, b, c}], Point@{0, 0, 0}}, PlotRange -> 2, 
  ClipPlanes -> {{0, -1, 0, 0}}, ClipPlanesStyle -> Opacity@.5], {a, 
  1, 2}, {b, 1, 2}, {c, 1, 2}]

enter image description here

POSTED BY: Kuba Podkalicki
Posted 10 years ago

Kuba,

Excellent answer! That first example was exactly what I needed. The first example is great, but I don't understand how the point array got passed to the Graphics3D function. I need to understand this: Point /@ %
Also, how can I convert that point array to floats instead of ratios, and then export the triple list to an external text file?

On the second example, where is the final point array? Again, how to export the point array of triples to an external text file?

The third example looks like it is outputting two numbers for each point, rather than three. What is going on here?

POSTED BY: Skip Cave
Posted 10 years ago

Well, the Cos[x} * Cos[y] function isn't working out so well for my particular application. It looks like I need to plot a half-ellipsoid on the plane instead of the cosine curves. How can I define an equation such that it will place a half-ellipsoid on my plane plot, instead of the cosine curve? In addition, I want to be able to adjust the length of the three axes of the ellipsoid. Eventually I want to be able to create an active notebook, where sliders will adjust the length of the three axes. The equation for the ellipsoid is x^2/a ^ 2 + y^2/b ^ 2 + z^2/c ^ 2 = 1 But I haven't been able to cut this ellipsoid in half, set it on a plane, and plot it.

POSTED BY: Updating Name
Posted 10 years ago

Kuba,

That is exactly what I was trying to do! You are truly a Mathematica expert.Now I'm able to test my project functions. Is there a way to map a .jpg texture on the ellipsoid surface? Also, I have to write code to implement that ellipsoid surface in my project. However the Wolfram Sphere function obscures all the underlying math for the ellipsoid. Is there a way to duplicate that exact same ellipsoid function in the notebook equation just using basic math and trig, and the cartesian coordinates x, y, and z?

POSTED BY: Skip Cave
Posted 10 years ago

Kuba, that's perfect! Now I understand what I need to do. I have re-written the equation for the ellipsoid into Cartesian coordinates, and limited the result to real numbers.

a := 3
b := 2
c := 3
rest := x^2/a^2 + y^2/b^2
f[x_, y_] := Re [c*(1 - rest )^0.5]
g[x_, y_] := If[f [x, y] < 0, 0, f[x, y]]
Plot3D[g[x, y], {x, 4, -4}, {y, 4, -4}]

Now I need to place a texture on that ellipse and plane from a local .jpg file, not from the web. The file is: c:/kah320x480.jpg. I tried replacing the http web address with my local path to my image, but no luck. How can I make my local image file map to the ellipse? I want the rectangular image file to map out over the plane as well as the ellipse. With the spherical example, the image is cut off at the ellipse boundary. How can I make the image map across the ellipse AND the plane?

.

POSTED BY: Skip Cave
Reply to this discussion
Community posts can be styled and formatted using the Markdown syntax.
Reply Preview
Attachments
Remove
or Discard

Group Abstract Group Abstract