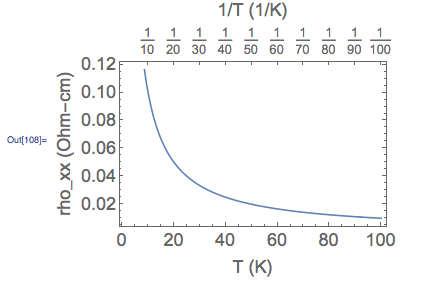
actually,
if you compare your figure with the graph I uploaded you see the difference...
I would like to plot on the x-axis 1/T going from low value on the left (high T) to high value on the right (low T).
yes, it would be nice to match on the upper x-axis the T corresponding to the 1/T value on the lower x-axis.
this might not be possible in mathematica, I think the x-axis always should go from low to high values towards the right.
if anybody knows,
please assist.
laurens
Plot[Sin[1/T], {T, 1, 100}, Axes -> False, Frame -> True,
FrameTicks -> {{Automatic, Automatic}, {Automatic,
Transpose[{#, 1/#}] &@
DeleteCases[FindDivisions[{1, 100}, 10], 0]}},
FrameLabel -> {{"rho_xx (Ohm-cm)", ""}, {"T (K)", "1/T (1/K)"}},
BaseStyle -> 18]
