Group Abstract Group Abstract

Message Boards Message Boards

0
|
11.3K Views
|
5 Replies
|
2 Total Likes
View groups...
Share
Share this post:

Plotting 1/x on x-axis

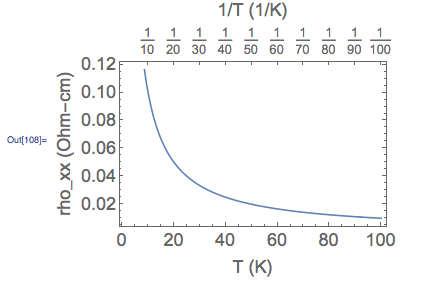
hello, i want to plot resistivity vs 1/T on the x-axis. how do I achieve this in Mathematica 10? enter image description here

Attachments:
5 Replies

actually you are right. the 1/T axis data points do increase from left to right.

ultimately, I want to fit the (natural logarithm of the) data rho_xx on the y-axis as a function of 1/T, not as a function of T. The upper x-axis is great, but can it also be used for fitting data?

I also have defined some functions that I want to plot as a function of 1/T, not T. I guess you can only achieve this by taking the function and replacing T with its reciprocal 1/T (variable substitution).

laurens

Posted 11 years ago

Not sure what do you mean, 1/T is gowing from left to right. Both, in your question images and in my answer.

POSTED BY: Kuba Podkalicki
Posted 11 years ago

I'm not sure what you are after. Is this helpful?

Plot[Sin[1/x], {x, .1, 10},
   Axes -> False,
   Frame -> True, 
   FrameTicks -> {{Automatic, Automatic}, {Automatic,  Transpose[{#, 1/#}] &@DeleteCases[FindDivisions[{.1, 10}, 5], 0]}},
   FrameLabel -> {{"f", ""}, {"1/t", "t"}},
   BaseStyle -> 18]

enter image description here

POSTED BY: Kuba Podkalicki
Reply to this discussion
Community posts can be styled and formatted using the Markdown syntax.
Reply Preview
Attachments
Remove
or Discard