Hi,
I am not quite sure whether I understand the problem. Because of the "weekend" there is no trading so there should be no points for the missing days. If your problem is about the plot and you do not want the ticks to be placed like that this might help:
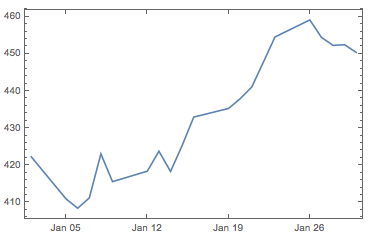
DateListPlot[data]
which gives:
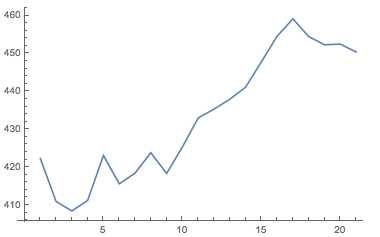
If you want to "delete the weekends" from the time series, and you think of the x-axis as trading days you can just plot the values:
data[[All, 2]] // ListLinePlot
A more complete solution might be this:
ListLinePlot[data[[All, 2]], Frame -> True, PlotStyle -> Directive[Red, Thickness[0.01]],
FrameTicks -> {{All, None}, {Table[{j, Rotate[DateString[DateObject@DatePlus[{2015, 1, 1},
{j, "BusinessDay"}]], Pi/2]}, {j, 1, Length[data], 1}], None}}]
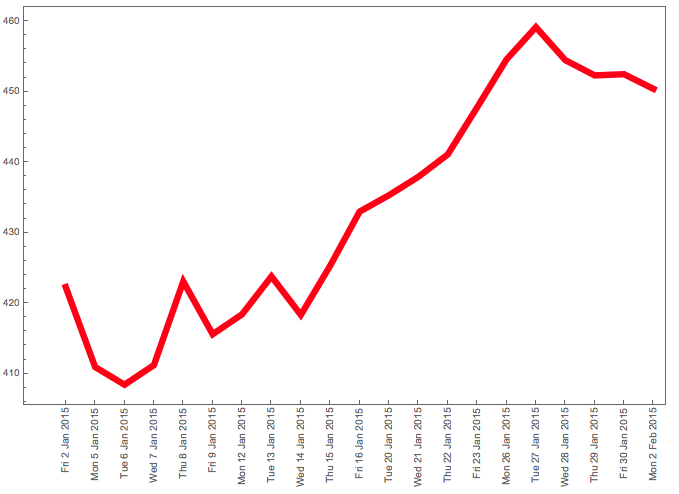
I am sure that there is a better way of doing it, but this one gives you quite a bit of control over the figure.
Cheers,
M.


